Nissan 2006 Annual Report Download - page 84
Download and view the complete annual report
Please find page 84 of the 2006 Nissan annual report below. You can navigate through the pages in the report by either clicking on the pages listed below, or by using the keyword search tool below to find specific information within the annual report.-
 1
1 -
2
-
3
-
4
-
5
-
6
-
7
-
8
-
9
-
10
-
11
-
12
-
13
-
14
-
15
-
16
-
17
-
18
-
19
-
20
-
21
-
22
-
23
-
24
-
25
-
26
-
27
-
28
-
29
-
30
-
31
-
32
-
33
-
34
-
35
-
36
-
37
-
38
-
39
-
40
-
41
-
42
-
43
-
44
-
45
-
46
-
47
-
48
-
49
-
50
-
51
-
52
-
53
-
54
-
55
-
56
-
57
-
58
-
59
-
60
-
61
-
62
-
63
-
64
-
65
-
66
-
67
-
68
-
69
-
70
-
71
-
72
-
73
-
 74
74 -
 75
75 -
 76
76 -
 77
77 -
 78
78 -
 79
79 -
 80
80 -
 81
81 -
 82
82 -
 83
83 -
 84
84 -
 85
85 -
 86
86 -
 87
87 -
 88
88 -
 89
89 -
 90
90 -
 91
91 -
 92
92 -
 93
93 -
 94
94 -
95
-
96
-
97
-
98
-
99
-
100
-
101
-
102
 |
 |
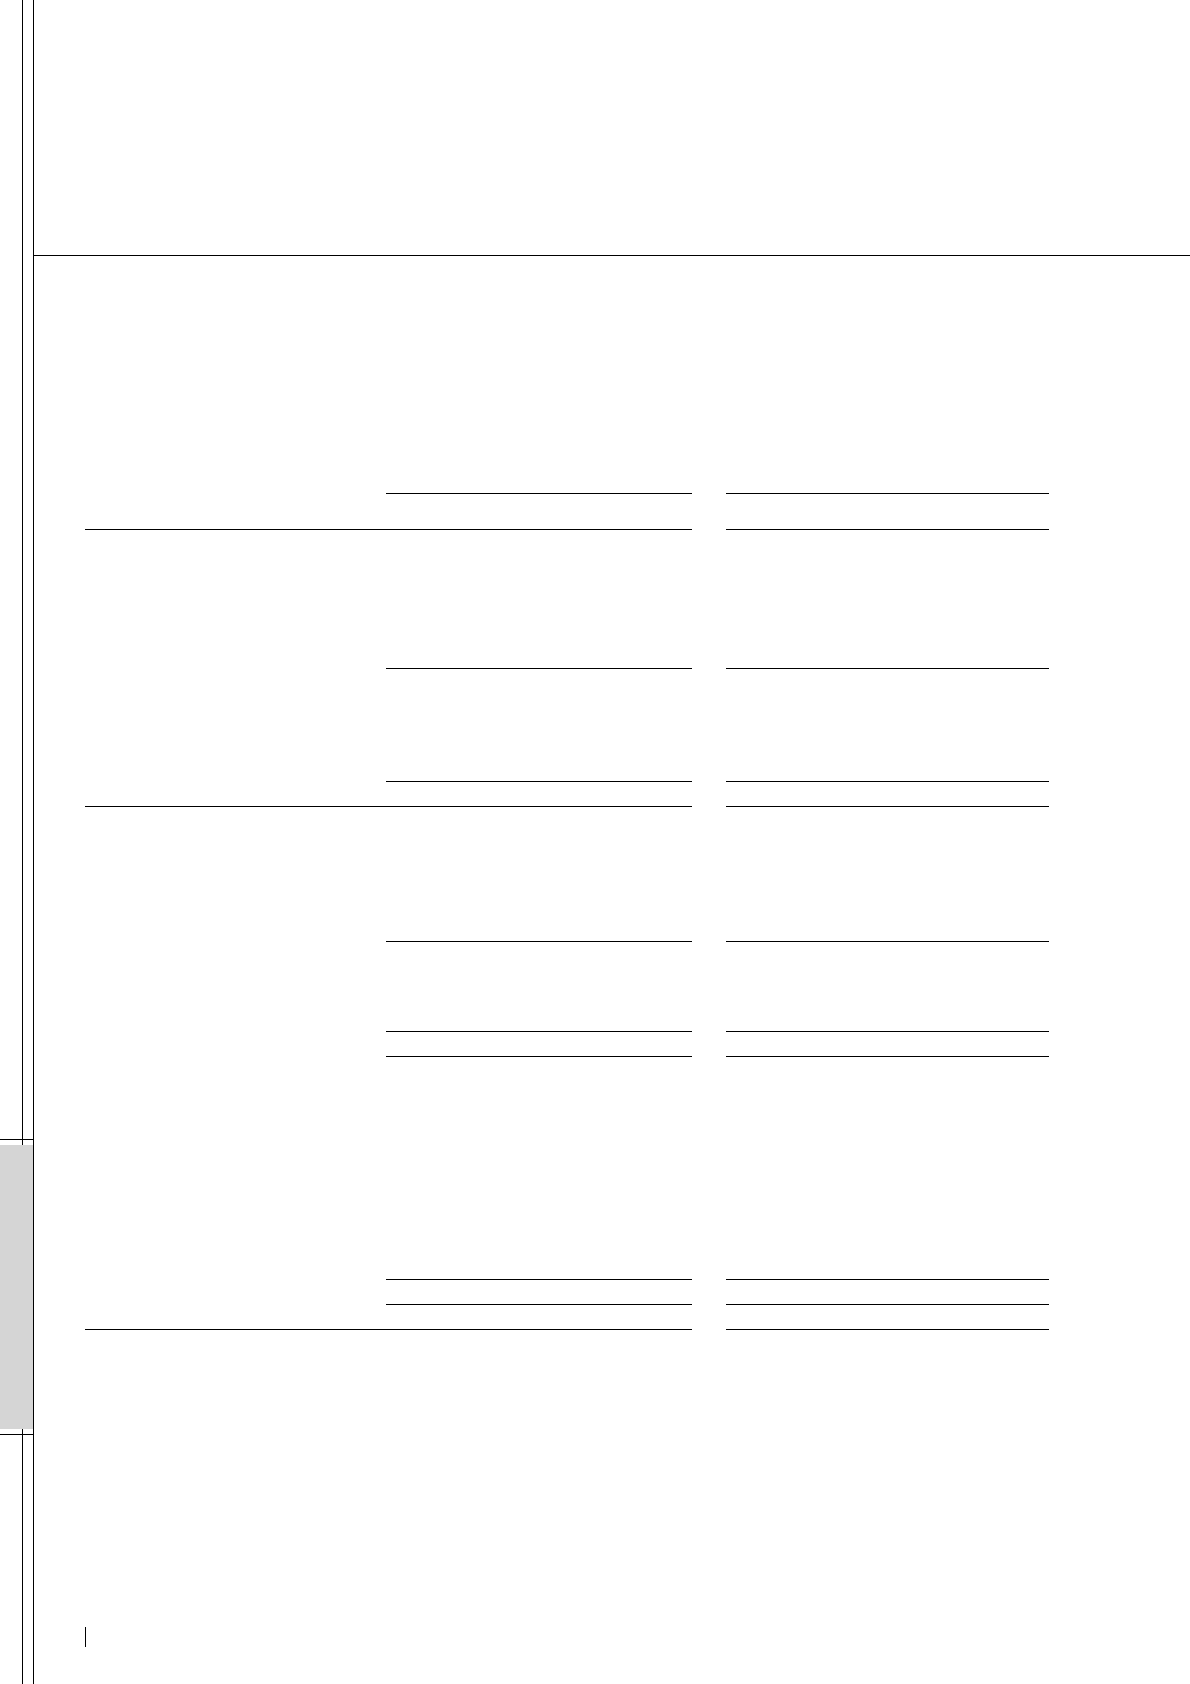
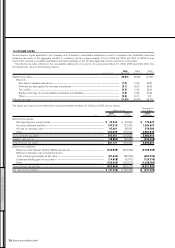
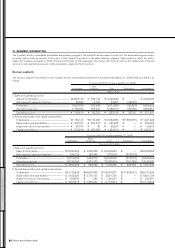
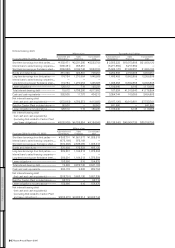
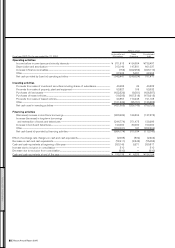
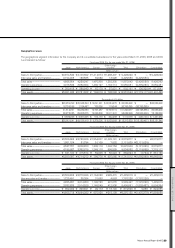
The following tables set forth the summarized financial statements by business segment for the years ended March 31, 2006, 2005 and 2004.
Amounts for the sales financing segment represent the aggregate of the figures for the sales financing subsidiaries and operations in Japan, the
United States, Canada and Mexico. Amounts for the automobile and Eliminations segment represent the differences between the consolidated
totals and those for the sales financing segment.
1) Summarized consolidated balance sheets by business segment
Millions of yen Thousands of U.S. dollars
Automobile and Sales Consolidated Automobile and Sales Consolidated
Fiscal year 2005 (As of Mar. 31, 2006) Eliminations Financing total Eliminations Financing total
Cash and cash equivalents................................... ¥ 392,505 ¥ 11,707 ¥ 404,212 $ 3,354,744 $ 100,059 $ 3,454,803
Short-term investments........................................... 22,051 98 22,149 188,470 838 189,308
Receivables, less allowance for
doubtful receivables ................................................ 228,405 3,761,343 3,989,748 1,952,179 32,148,231 34,100,410
Inventories.......................................................................... 847,243 9,256 856,499 7,241,393 79,111 7,320,504
Other current assets .................................................. 481,236 268,410 749,646 4,113,128 2,294,103 6,407,231
Total current assets.................................................... 1,971,440 4,050,814 6,022,254 16,849,914 34,622,342 51,472,256
Property, plant and equipment, net ................ 2,926,753 1,512,055 4,438,808 25,014,983 12,923,547 37,938,530
Investment securities................................................. 401,520 1,866 403,386 3,431,795 15,949 3,447,744
Other assets...................................................................... 471,474 145,504 616,978 4,029,692 1,243,624 5,273,316
Total assets ....................................................................... ¥5,771,187 ¥5,710,239 ¥11,481,426 $49,326,384 $48,805,462 $98,131,846
Short-term borrowings and current
portion of long-term debt................................... ¥ (608,176) ¥3,200,465 ¥ 2,592,289 $ (5,198,086) $27,354,402 $22,156,316
Notes and accounts payable............................... 1,482,002 50,318 1,532,320 12,666,684 430,068 13,096,752
Accrued income taxes.............................................. 90,428 15,559 105,987 772,889 132,983 905,872
Other current liabilities............................................. 539,351 81,762 621,113 4,609,838 698,820 5,308,658
Total current liabilities............................................... 1,503,605 3,348,104 4,851,709 12,851,325 28,616,273 41,467,598
Long-term debt .............................................................. 627,788 1,597,815 2,225,603 5,365,709 13,656,539 19,022,248
Other long-term liabilities....................................... 677,426 352,812 1,030,238 5,789,966 3,015,487 8,805,453
Total long-term liabilities......................................... 1,305,214 1,950,627 3,255,841 11,155,675 16,672,026 27,827,701
Total liabilities.................................................................. 2,808,819 5,298,731 8,107,550 24,007,000 45,288,299 69,295,299
Minority interests........................................................... 284,062 1,831 285,893 2,427,880 15,650 2,443,530
Common stock................................................................ 514,489 91,325 605,814 4,397,342 780,555 5,177,897
Capital surplus................................................................. 773,623 30,847 804,470 6,612,162 263,650 6,875,812
Retained earnings........................................................ 1,855,971 260,854 2,116,825 15,863,000 2,229,521 18,092,521
Unrealized holding gain on securities.......... 14,156 184 14,340 120,991 1,573 122,564
Translation adjustments.......................................... (230,780) 26,467 (204,313) (1,972,478) 226,214 (1,746,264)
Treasury stock................................................................. (249,153) — (249,153) (2,129,513) — (2,129,513)
Total shareholders’ equity...................................... 2,678,306 409,677 3,087,983 22,891,504 3,501,513 26,393,017
Total liabilities and shareholders’ equity .... ¥5,771,187 ¥5,710,239 ¥11,481,426 $49,326,384 $48,805,462 $98,131,846
Nissan Annual Report 2005
82
FINANCIAL SECTION