Nissan 2006 Annual Report Download - page 15
Download and view the complete annual report
Please find page 15 of the 2006 Nissan annual report below. You can navigate through the pages in the report by either clicking on the pages listed below, or by using the keyword search tool below to find specific information within the annual report.-
 1
1 -
2
-
3
-
4
-
 5
5 -
 6
6 -
 7
7 -
 8
8 -
 9
9 -
 10
10 -
 11
11 -
 12
12 -
 13
13 -
 14
14 -
 15
15 -
 16
16 -
 17
17 -
 18
18 -
 19
19 -
 20
20 -
 21
21 -
 22
22 -
 23
23 -
 24
24 -
 25
25 -
26
-
27
-
28
-
29
-
30
-
31
-
32
-
33
-
34
-
35
-
36
-
37
-
38
-
39
-
40
-
41
-
42
-
43
-
44
-
45
-
46
-
47
-
48
-
49
-
50
-
51
-
52
-
53
-
54
-
55
-
56
-
57
-
58
-
59
-
60
-
61
-
62
-
63
-
64
-
65
-
66
-
67
-
68
-
69
-
70
-
71
-
72
-
73
-
74
-
75
-
76
-
77
-
78
-
79
-
80
-
81
-
82
-
83
-
84
-
85
-
86
-
87
-
88
-
89
-
90
-
91
-
92
-
93
-
94
-
95
-
96
-
97
-
98
-
99
-
100
-
101
-
102
 |
 |

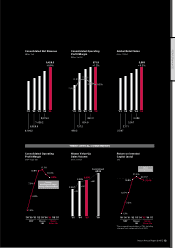
’01 ’02 ’03 ’04 ’05
6
,
196.2
6,828.6
7,429.2
8,576.3
9,428.3
+9.9%
’01 ’02 ’03 ’04 ’05
489.2
737.2
824.9
861.2
871.8
+1.2%
’01 ’02 ’03 ’04 ’05
2
,
597
2,771
3,057
3,389
3,569
+5.3%
9.2%
10.8% 11.1%
10.0%
7.9%
Nissan Annual Report 2005 13
Consolidated Net Revenue
(Billion Yen)
Consolidated Operating
Profit/Margin
(Billion Yen/%)
Global Retail Sales
(Units: 1000s)
PERFORMANCE
3,389 3,569
4,200
’01 ’04 ’08
’05
Commitment
+791
+181
+631
2,597
Nissan Value-Up
Sales Volume
(Units: 1000s)
THREE CRITICAL COMMITMENTS
Consolidated Operating
Profit Margin
COP margin (%)
Top level
operating profit margin
among global automakers
1.4%
4.8%
7.9%
10.8%
10.0%
9.2%
11.1%
NRP Nissan
180
Nissan
Value-Up
’99 ’00 ’01 ’02 ’03 ’04 ’05 ’06 ’07
Return on Invested
Capital (auto)
(%)
ROIC
average of 20%
1.3%
7.5%
12.7%
19.8%
20.1%*
19.4%
21.3%
NRP Nissan
180
Nissan
Value-Up
’99 ’00 ’01 ’02 ’03 ’04 ’05 ’06 ’07
*Same scope pf consolidation as P&L, excluding
change of cash compared to fiscal 2003