Nissan 2006 Annual Report Download - page 66
Download and view the complete annual report
Please find page 66 of the 2006 Nissan annual report below. You can navigate through the pages in the report by either clicking on the pages listed below, or by using the keyword search tool below to find specific information within the annual report.-
 1
1 -
2
-
3
-
4
-
5
-
6
-
7
-
8
-
9
-
10
-
11
-
12
-
13
-
14
-
15
-
16
-
17
-
18
-
19
-
20
-
21
-
22
-
23
-
24
-
25
-
26
-
27
-
28
-
29
-
30
-
31
-
32
-
33
-
34
-
35
-
36
-
37
-
38
-
39
-
40
-
41
-
42
-
43
-
44
-
45
-
46
-
47
-
48
-
49
-
50
-
51
-
52
-
53
-
54
-
55
-
 56
56 -
 57
57 -
 58
58 -
 59
59 -
 60
60 -
 61
61 -
 62
62 -
 63
63 -
 64
64 -
 65
65 -
 66
66 -
 67
67 -
 68
68 -
 69
69 -
 70
70 -
 71
71 -
 72
72 -
 73
73 -
 74
74 -
 75
75 -
 76
76 -
77
-
78
-
79
-
80
-
81
-
82
-
83
-
84
-
85
-
86
-
87
-
88
-
89
-
90
-
91
-
92
-
93
-
94
-
95
-
96
-
97
-
98
-
99
-
100
-
101
-
102
 |
 |
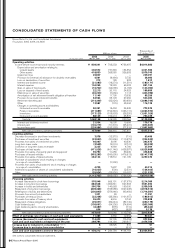
Thousands of
Millions of yen U.S. dollars (Note 3)
2005 2004 2003 2005
For the years ended Mar. 31, 2006 Mar. 31, 2005 Mar. 31, 2004 Mar. 31, 2006
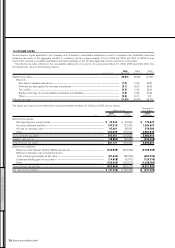
Operating activities
Income before income taxes and minority interests ¥ 809,041 ¥ 793,233 ¥736,497 $6,914,880
Depreciation and amortization relating to:
Leased assets 236,572 157,346 134,354 2,021,983
Other assets 418,830 368,580 326,683 3,579,743
Impairment loss 26,827 ——229,291
Provision for (reversal of) allowance for doubtful receivables 4,561 (6,464) 3,732 38,983
Loss on devaluation of securities 212 128 323 1,812
Interest and dividend income (21,080) (16,274) (11,591) (180,171)
Interest expense 104,265 73,220 63,423 891,154
Gain on sales of fixed assets (16,742) (24,038) (4,163) (143,094)
Loss on disposal of fixed assets 22,213 20,115 24,823 189,855
(Gain) loss on sales of securities (40,223) (7,232) 7,113 (343,786)
Amortization of net retirement benefit obligation at transition 11,145 11,795 13,936 95,256
Provision for accrued retirement benefits 63,564 65,103 67,262 543,282
Retirement benefits paid (314,349) (82,924) (80,650) (2,686,744)
Other 13,587 (115) 45,934 116,129
Changes in operating assets and liabilities:
Notes and accounts receivable 90,391 15,494 24,539 772,573
Finance receivables (311,685) (794,349) (463,110) (2,663,974)
Inventories (117,120) (108,903) (28,220) (1,001,026)
Notes and accounts payable 88,129 152,213 68,879 753,239
Subtotal 1,068,138 616,928 929,764 9,129,385
Interest and dividends received 21,034 16,098 10,699 179,778
Interest paid (102,219) (71,318) (65,231) (873,667)
Income taxes paid (229,084) (192,293) (77,815) (1,957,983)
Net cash provided by operating activities 757,869 369,415 797,417 6,477,513
Investing activities
Decrease (increase) in short-term investments 7,078 (12,370) (710) 60,496
Purchases of investment securities (23,930) (31,896) (119,372) (204,530)
Proceeds from sales of investment securities 46,060 3,098 40,330 393,675
Long-term loans made (3,549) (4,019) (3,741) (30,333)
Collection of long-term loans receivable 3,225 4,860 4,766 27,564
Purchases of fixed assets (471,029) (461,146) (428,387) (4,025,889)
Proceeds from sales of property, plant and equipment 55,790 71,256 53,932 476,838
Purchases of leased vehicles (953,285) (590,605) (476,613) (8,147,735)
Proceeds from sales of leased vehicles 264,124 173,812 191,105 2,257,470
Purchase of subsidiaries’ stock resulting in changes
in scope of consolidation —(1,292) — —
Proceeds from sales of subsidiaries’ stock resulting in changes
in scope of consolidation 4,705 7,697 192 40,214
Additional acquisition of shares of consolidated subsidiaries (16,020) (500) (2,531) (136,923)
Other (25,924) (23,930) (15,097) (221,573)
Net cash used in investing activities (1,112,755) (865,035) (756,126) (9,510,726)
Financing activities
Increase (decrease) in short-term borrowings 376,048 666,191 (137,575) 3,214,085
Increase in long-term borrowings 883,548 1,050,841 847,393 7,551,692
Increase in bonds and debentures 390,706 140,663 150,000 3,339,368
Repayment of long-term borrowings (809,466) (765,588) (627,238) (6,918,513)
Redemption of bonds and debentures (200,840) (379,946) (93,456) (1,716,581)
Proceeds from minority shareholders 1,321 30 — 11,291
Purchases of treasury stock (22,208) (33,366) (101,957) (189,812)
Proceeds from sales of treasury stock 26,423 6,816 9,744 225,838
Repayment of lease obligations (76,071) (69,244) (84,742) (650,179)
Cash dividends paid (105,661) (94,236) (74,594) (903,085)
Cash dividends paid to minority shareholders (6,487) (678) (712) (55,444)
Other 606 (437) (603) 5,178
Net cash provided by (used in) financing activities 457,919 521,046 (113,740) 3,913,838
Effect of exchange rate changes on cash and cash equivalents 11,389 4,369 (2,604) 97,341
Increase (decrease) in cash and cash equivalents 114,422 29,795 (75,053) 977,966
Cash and cash equivalents at beginning of the year 289,784 194,164 269,817 2,476,786
Increase due to inclusion in consolidation (Note15) 6 65,825 310 51
Decrease due to exclusion from consolidation —— (910) —
Cash and cash equivalents at end of the year ¥ 404,212 ¥ 289,784 ¥194,164 $3,454,803
See notes to consolidated financial statements.
CONSOLIDATED STATEMENTS OF CASH FLOWS
Nissan Motor Co., Ltd. and Consolidated Subsidiaries
Fiscal years 2005, 2004 and 2003
Nissan Annual Report 2005
64
FINANCIAL SECTION