Nissan 2006 Annual Report Download - page 87
Download and view the complete annual report
Please find page 87 of the 2006 Nissan annual report below. You can navigate through the pages in the report by either clicking on the pages listed below, or by using the keyword search tool below to find specific information within the annual report.-
 1
1 -
2
-
3
-
4
-
5
-
6
-
7
-
8
-
9
-
10
-
11
-
12
-
13
-
14
-
15
-
16
-
17
-
18
-
19
-
20
-
21
-
22
-
23
-
24
-
25
-
26
-
27
-
28
-
29
-
30
-
31
-
32
-
33
-
34
-
35
-
36
-
37
-
38
-
39
-
40
-
41
-
42
-
43
-
44
-
45
-
46
-
47
-
48
-
49
-
50
-
51
-
52
-
53
-
54
-
55
-
56
-
57
-
58
-
59
-
60
-
61
-
62
-
63
-
64
-
65
-
66
-
67
-
68
-
69
-
70
-
71
-
72
-
73
-
74
-
75
-
76
-
 77
77 -
 78
78 -
 79
79 -
 80
80 -
 81
81 -
 82
82 -
 83
83 -
 84
84 -
 85
85 -
 86
86 -
 87
87 -
 88
88 -
 89
89 -
 90
90 -
 91
91 -
 92
92 -
 93
93 -
 94
94 -
 95
95 -
 96
96 -
 97
97 -
98
-
99
-
100
-
101
-
102
 |
 |
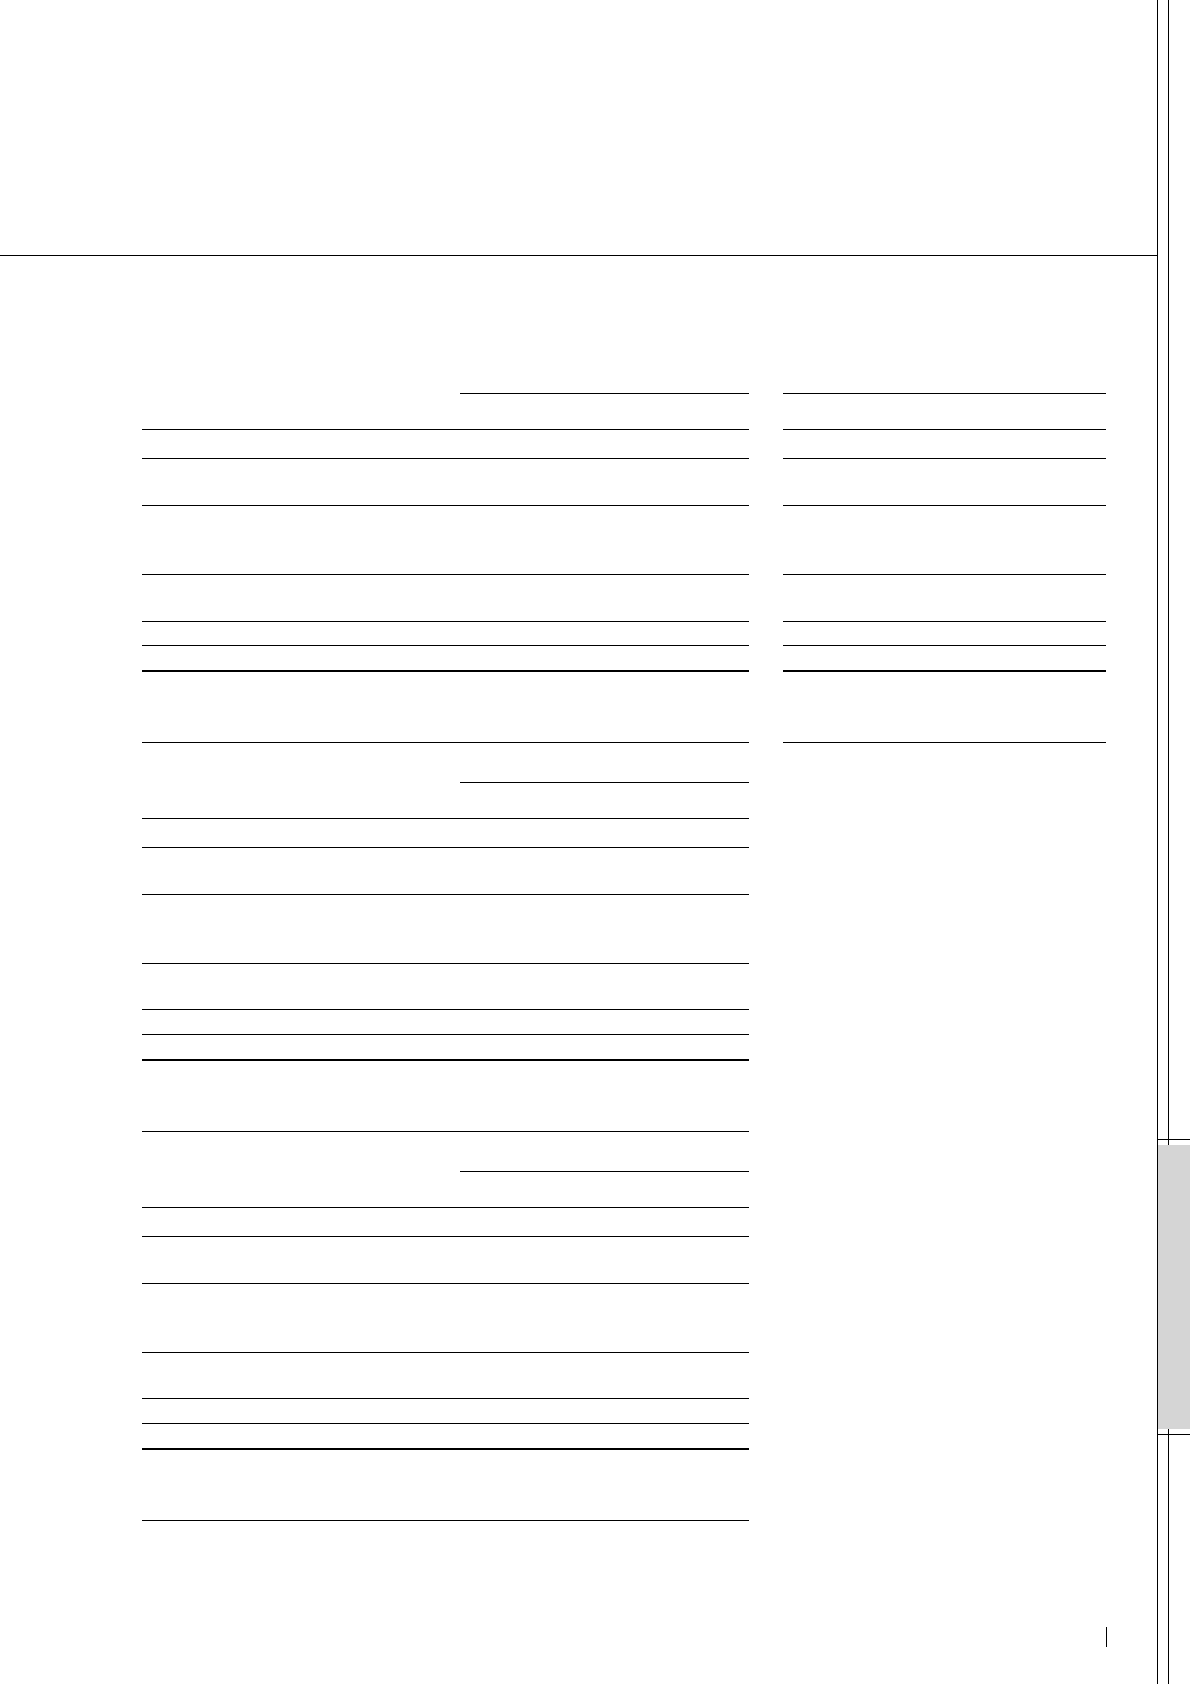
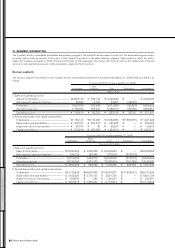
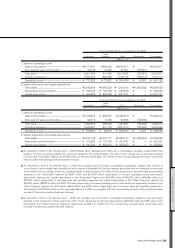
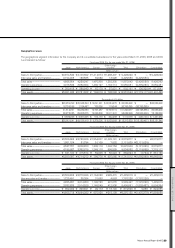
2) Summarized consolidated statements of income by business segment
Millions of yen Thousands of U.S. dollars
Automobile and Sales Consolidated Automobile and Sales Consolidated
Fiscal year 2005
(For the year ended Mar. 31, 2006)
Eliminations Financing total Eliminations Financing total
Net sales.................................................................................... ¥8,880,349 ¥547,943 ¥9,428,292 $75,900,419 $4,683,273 $80,583,692
Cost of sales........................................................................... 6,649,937 391,050 7,040,987 56,837,068 3,342,308 60,179,376
Gross profit.............................................................................. 2,230,412 156,893 2,387,305 19,063,351 1,340,965 20,404,316
Operating income............................................................... 802,116 69,725 871,841 6,855,692 595,940 7,451,632
Operating income as a percentage of net sales
...... 9.0% 12.7% 9.2% 9.0% 12.7% 9.2%
Net financial cost................................................................ (4,555) (11) (4,566) (38,932) (94) (39,026)
Income before income taxes and
minority interests.............................................................. 739,962 69,079 809,041 6,324,462 590,418 6,914,880
Net income............................................................................... ¥ 476,688 ¥ 41,362 ¥ 518,050 $ 4,074,256 $ 353,522 $ 4,427,778
Total net financial cost................................................... ¥ (4,555) ¥ (11) ¥ (4,566) $ (38,932) $ (94) $ (39,026)
Interest on lease obligations ..................................... (3,952) (16) (3,968) (33,778) (137) (33,915)
Intersegment eliminations ........................................... (37,507) — (37,507) (320,573) — (320,573)
Net financial cost for segment ................................ 36,904 5 36,909 315,419 43 315,462
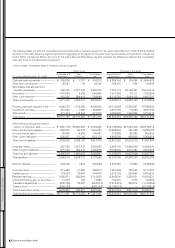
Millions of yen
Automobile and Sales Consolidated
Fiscal year 2004
(For the year ended Mar. 31, 2005)
Eliminations Financing total
Net sales.................................................................................... ¥8,164,332 ¥411,945 ¥8,576,277
Cost of sales........................................................................... 6,094,196 257,073 6,351,269
Gross profit.............................................................................. 2,070,136 154,872 2,225,008
Operating income............................................................... 787,603 73,557 861,160
Operating income as a percentage of net sales
...... 9.6% 17.9% 10.0%
Net financial cost................................................................ (10,371) (11) (10,382)
Income before income taxes and
minority interests.............................................................. 720,764 72,469 793,233
Net income............................................................................... ¥ 472,680 ¥ 39,601 ¥ 512,281
Total net financial cost................................................... ¥ (10,371) ¥ (11) ¥ (10,382)
Interest on lease obligations ..................................... (4,097) (20) (4,117)
Intersegment eliminations ........................................... (12,524) — (12,524)
Net financial cost for segment ................................ 6,250 9 6,259
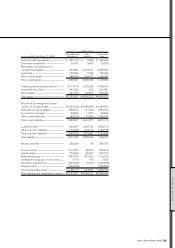
Millions of yen
Automobile and Sales Consolidated
Fiscal year 2003
(For the year ended Mar. 31, 2004)
Eliminations Financing total
Net sales.................................................................................... ¥7,063,230 ¥365,989 ¥7,429,219
Cost of sales........................................................................... 5,098,056 212,116 5,310,172
Gross profit.............................................................................. 1,965,174 153,873 2,119,047
Operating income............................................................... 760,045 64,810 824,855
Operating income as a percentage of net sales
...... 10.8% 17.7% 11.1%
Net financial cost................................................................ (15,669) (30) (15,699)
Income before income taxes and
minority interests.............................................................. 671,513 64,984 736,497
Net income............................................................................... ¥ 465,329 ¥ 38,338 ¥ 503,667
Total net financial cost................................................... ¥ (15,669) ¥ (30) ¥ (15,699)
Interest on lease obligations ..................................... (4,603) (20) (4,623)
Intersegment eliminations ........................................... (5,322) — (5,322)
Net financial cost for segment ................................ (5,744) (10) (5,754)
Nissan Annual Report 2005 85
FINANCIAL SECTION