Nissan 2006 Annual Report Download - page 91
Download and view the complete annual report
Please find page 91 of the 2006 Nissan annual report below. You can navigate through the pages in the report by either clicking on the pages listed below, or by using the keyword search tool below to find specific information within the annual report.-
 1
1 -
2
-
3
-
4
-
5
-
6
-
7
-
8
-
9
-
10
-
11
-
12
-
13
-
14
-
15
-
16
-
17
-
18
-
19
-
20
-
21
-
22
-
23
-
24
-
25
-
26
-
27
-
28
-
29
-
30
-
31
-
32
-
33
-
34
-
35
-
36
-
37
-
38
-
39
-
40
-
41
-
42
-
43
-
44
-
45
-
46
-
47
-
48
-
49
-
50
-
51
-
52
-
53
-
54
-
55
-
56
-
57
-
58
-
59
-
60
-
61
-
62
-
63
-
64
-
65
-
66
-
67
-
68
-
69
-
70
-
71
-
72
-
73
-
74
-
75
-
76
-
77
-
78
-
79
-
80
-
 81
81 -
 82
82 -
 83
83 -
 84
84 -
 85
85 -
 86
86 -
 87
87 -
 88
88 -
 89
89 -
 90
90 -
 91
91 -
 92
92 -
 93
93 -
 94
94 -
 95
95 -
 96
96 -
 97
97 -
 98
98 -
 99
99 -
 100
100 -
 101
101 -
102
 |
 |

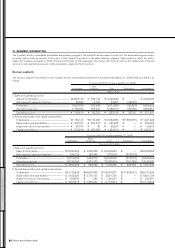
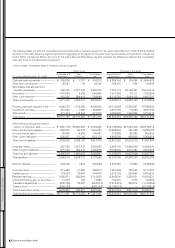
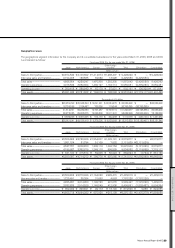
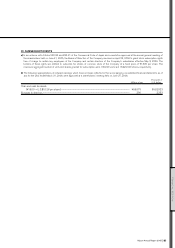
Geographical areas
The geographical segment information for the Company and its consolidated subsidiaries for the years ended March 31, 2006, 2005 and 2004
is summarized as follows:
Fiscal year 2005 (For the year ended Mar. 31, 2006)
Other foreign
Japan North America Europe countries Total Eliminations Consolidated
Millions of yen
Sales to third parties.......................................... ¥2,674,549 ¥4,100,662 ¥1,414,674 ¥1,238,407 ¥ 9,428,292 ¥ — ¥ 9,428,292
Inter-area sales and transfers .................... 2,194,405 138,585 82,632 13,928 2,429,550 (2,429,550) —
Total sales................................................................... 4,868,954 4,239,247 1,497,306 1,252,335 11,857,842 (2,429,550) 9,428,292
Operating expenses........................................... 4,478,536 3,852,304 1,430,127 1,194,714 10,955,681 (2,399,230) 8,556,451
Operating income................................................. ¥ 390,418 ¥ 386,943 ¥ 67,179 ¥ 57,621 ¥ 902,161 ¥ (30,320) ¥ 871,841
Total assets ............................................................... ¥5,961,342 ¥5,751,652 ¥ 746,016 ¥ 798,533 ¥13,257,543 ¥(1,776,117) ¥11,481,426
Thousands of U.S. dollars
Sales to third parties..........................................
$22,859,393 $35,048,393 $12,091,231 $10,584,675 $ 80,583,692 $ — $80,583,692
Inter-area sales and transfers ....................
18,755,598 1,184,487 706,256 119,044 20,765,385 (20,765,385) —
Total sales...................................................................
41,614,991 36,232,880 12,797,487 10,703,719 101,349,077 (20,765,385) 80,583,692
Operating expenses...........................................
38,278,085 32,925,675 12,223,308 10,211,231 93,638,299 (20,506,239) 73,132,060
Operating income.................................................
$ 3,336,906 $ 3,307,205 $ 574,179 $ 492,488 $ 7,710,778 $ (259,146) $ 7,451,632
Total assets ...............................................................
$50,951,641 $49,159,419 $ 6,376,205 $ 6,825,068 $113,312,333 $(15,180,487) $98,131,846
Fiscal year 2004 (For the year ended Mar. 31, 2005)
Other foreign
Japan North America Europe countries Total Eliminations Consolidated
Millions of yen
Sales to third parties.......................................... ¥2,556,683 ¥3,726,456 ¥1,254,007 ¥1,039,131 ¥ 8,576,277 ¥ — ¥8,576,277
Inter-area sales and transfers .................... 1,981,104 81,794 51,109 7,622 2,121,629 ¥(2,121,629) —
Total sales................................................................... 4,537,787 3,808,250 1,305,116 1,046,753 10,697,906 (2,121,629) 8,576,277
Operating expenses........................................... 4,196,667 3,392,676 1,249,110 996,529 9,834,982 (2,119,865) 7,715,117
Operating income................................................. ¥ 341,120 ¥ 415,574 ¥ 56,006 ¥ 50,224 ¥ 862,924 ¥ (1,764) ¥ 861,160
Total assets ............................................................... ¥5,590,397 ¥4,714,272 ¥ 799,778 ¥ 637,065 ¥11,741,512 ¥(1,892,989) ¥9,848,523
Fiscal year 2003 (For the year ended Mar. 31, 2004)
Other foreign
Japan North America Europe countries Total Eliminations Consolidated
Millions of yen
Sales to third parties.......................................... ¥2,559,806 ¥3,278,966 ¥1,164,032 ¥426,415 ¥7,429,219 ¥ — ¥7,429,219
Inter-area sales and transfers
.............................. 1,725,491 35,384 31,690 4,663 1,797,228 (1,797,228) —
Total sales................................................................... 4,285,297 3,314,350 1,195,722 431,078 9,226,447 (1,797,228) 7,429,219
Operating expenses........................................... 3,932,835 2,914,529 1,146,549 412,938 8,406,851 (1,802,487) 6,604,364
Operating income................................................. ¥ 352,462 ¥ 399,821 ¥ 49,173 ¥ 18,140 ¥ 819,596 ¥ 5,259 ¥ 824,855
Total assets ............................................................... ¥4,805,718 ¥3,664,382 ¥ 607,926 ¥219,109 ¥9,297,135 ¥(1,437,279) ¥7,859,856
Nissan Annual Report 2005 89
FINANCIAL SECTION