Nissan 2006 Annual Report Download - page 83
Download and view the complete annual report
Please find page 83 of the 2006 Nissan annual report below. You can navigate through the pages in the report by either clicking on the pages listed below, or by using the keyword search tool below to find specific information within the annual report.-
 1
1 -
2
-
3
-
4
-
5
-
6
-
7
-
8
-
9
-
10
-
11
-
12
-
13
-
14
-
15
-
16
-
17
-
18
-
19
-
20
-
21
-
22
-
23
-
24
-
25
-
26
-
27
-
28
-
29
-
30
-
31
-
32
-
33
-
34
-
35
-
36
-
37
-
38
-
39
-
40
-
41
-
42
-
43
-
44
-
45
-
46
-
47
-
48
-
49
-
50
-
51
-
52
-
53
-
54
-
55
-
56
-
57
-
58
-
59
-
60
-
61
-
62
-
63
-
64
-
65
-
66
-
67
-
68
-
69
-
70
-
71
-
72
-
 73
73 -
 74
74 -
 75
75 -
 76
76 -
 77
77 -
 78
78 -
 79
79 -
 80
80 -
 81
81 -
 82
82 -
 83
83 -
 84
84 -
 85
85 -
 86
86 -
 87
87 -
 88
88 -
 89
89 -
 90
90 -
 91
91 -
 92
92 -
 93
93 -
94
-
95
-
96
-
97
-
98
-
99
-
100
-
101
-
102
 |
 |
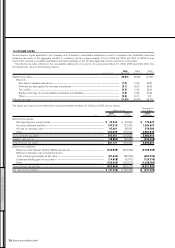
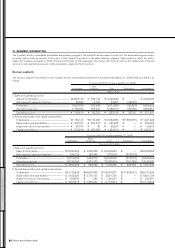
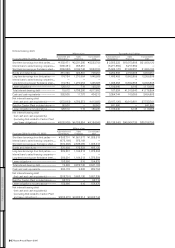
Fiscal year 2004 (For the year ended Mar. 31, 2005)
Sales
Automobile Financing Total Eliminations Consolidated
Millions of yen
I. Sales and operating income
Sales to third parties................................................................................... ¥8,177,841 ¥398,436 ¥8,576,277 ¥ — ¥8,576,277
Inter-segment sales and transfers................................................... 23,742 13,509 37,251 (37,251) —
Total sales............................................................................................................ 8,201,583 411,945 8,613,528 (37,251) 8,576,277
Operating expenses.................................................................................... 7,429,760 338,388 7,768,148 (53,031) 7,715,117
Operating income.......................................................................................... ¥ 771,823 ¥ 73,557 ¥ 845,380 ¥ 15,780 ¥ 861,160
II. Assets, depreciation and capital expenditures
Total assets ........................................................................................................ ¥6,646,594 ¥4,596,322 ¥11,242,916 ¥(1,394,393) ¥9,848,523
Depreciation and amortization............................................................ ¥ 349,163 ¥ 176,763 ¥ 525,926 ¥ — ¥ 525,926
Capital expenditures................................................................................... ¥ 469,283 ¥ 582,468 ¥ 1,051,751 ¥ — ¥1,051,751
Fiscal year 2003 (For the year ended Mar. 31, 2004)
Sales
Automobile Financing Total Eliminations Consolidated
Millions of yen
I. Sales and operating income
Sales to third parties................................................................................... ¥7,072,982 ¥ 356,237 ¥7,429,219 ¥ — ¥7,429,219
Inter-segment sales and transfers................................................... 22,916 9,752 32,668 (32,668) —
Total sales............................................................................................................ 7,095,898 365,989 7,461,887 (32,668) 7,429,219
Operating expenses.................................................................................... 6,340,631 301,179 6,641,810 (37,446) 6,604,364
Operating income.......................................................................................... ¥ 755,267 ¥ 64,810 ¥ 820,077 ¥ 4,778 ¥ 824,855
II. Assets, depreciation and capital expenditures
Total assets ........................................................................................................ ¥5,847,139 ¥3,479,171 ¥9,326,310 ¥(1,466,454) ¥7,859,856
Depreciation and amortization............................................................ ¥ 313,289 ¥ 147,748 ¥ 461,037 ¥ — ¥ 461,037
Capital expenditures................................................................................... ¥ 441,384 ¥ 463,616 ¥ 905,000 ¥ — ¥ 905,000
Nissan Annual Report 2005 81
FINANCIAL SECTION
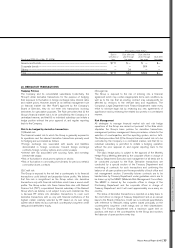
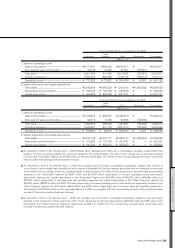
a) As described in Note 2 (b), effective April 1, 2003, Nissan Motor Manufacturing (UK) Ltd., a consolidated subsidiary, implemented early
adoption of a new accounting standard for retirement benefits in the United Kingdom. The effect of this change was to decrease operating
income in the “Automobile” segment by ¥1,686 million for the year ended March 31, 2004 from the corresponding amount which would have
been recorded if the previous method had been followed.
b) As described in Note 2 (c), effective April 1, 2003, the Company and its domestic consolidated subsidiaries changed their method of
accounting for noncancelable lease transactions which transfer substantially all risks and rewards associated with the ownership of the assets
to the lessee, from accounting for them as operating leases, to finance leases. The effect of this change was to decrease sales and operating
expenses in the “Automobile” segment by ¥237 million and ¥21,805 million respectively, to increase operating income, total assets,
depreciation expense and capital expenditures in the “Automobile” segment by ¥21,568 million ¥136,522 million, ¥46,986 million and
¥55,581 million, respectively, to decrease sales and operating expenses and capital expenditures in the “Sales Financing” segment by
¥33,351 million, ¥33,374 million and ¥29,716 million, respectively, to increase operating income, total assets and depreciation expense in the
“Sales Financing” segment by ¥23 million, ¥662 million and ¥292 million, respectively, and to increase sales and operating expenses in
“Eliminations” by ¥15,645 million for the year ended March 31, 2004 as compared with the corresponding amounts which would have been
recorded if the previous method had been followed.
c) As described in Note 2 (f), effective April 1, 2005, the Company and its domestic consolidated subsidiaries adopted a new accounting
standard for the impairment of fixed assets. The effect of this change was to decrease total assets by ¥26,794 million and ¥33 million in the
“Automobile” and “Sales Financing” segments, respectively, at March 31, 2006 from the corresponding amounts which would have been
recorded if the previous method had been followed.