Nissan 2006 Annual Report Download - page 74
Download and view the complete annual report
Please find page 74 of the 2006 Nissan annual report below. You can navigate through the pages in the report by either clicking on the pages listed below, or by using the keyword search tool below to find specific information within the annual report.-
 1
1 -
2
-
3
-
4
-
5
-
6
-
7
-
8
-
9
-
10
-
11
-
12
-
13
-
14
-
15
-
16
-
17
-
18
-
19
-
20
-
21
-
22
-
23
-
24
-
25
-
26
-
27
-
28
-
29
-
30
-
31
-
32
-
33
-
34
-
35
-
36
-
37
-
38
-
39
-
40
-
41
-
42
-
43
-
44
-
45
-
46
-
47
-
48
-
49
-
50
-
51
-
52
-
53
-
54
-
55
-
56
-
57
-
58
-
59
-
60
-
61
-
62
-
63
-
 64
64 -
 65
65 -
 66
66 -
 67
67 -
 68
68 -
 69
69 -
 70
70 -
 71
71 -
 72
72 -
 73
73 -
 74
74 -
 75
75 -
 76
76 -
 77
77 -
 78
78 -
 79
79 -
 80
80 -
 81
81 -
 82
82 -
 83
83 -
 84
84 -
85
-
86
-
87
-
88
-
89
-
90
-
91
-
92
-
93
-
94
-
95
-
96
-
97
-
98
-
99
-
100
-
101
-
102
 |
 |

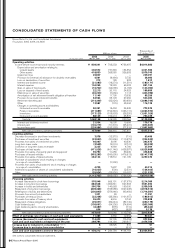
FINANCIAL SECTION
Nissan Annual Report 2005
72
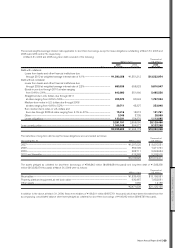
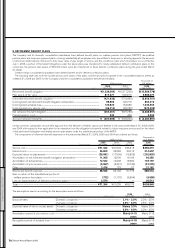
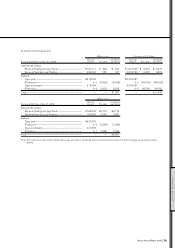
13. INCOME TAXES
Income taxes in Japan applicable to the Company and its domestic consolidated subsidiaries consist of corporation tax, inhabitants’ taxes and
enterprise tax, which, in the aggregate, resulted in a statutory tax rate of approximately 41% for 2005 and 2004 and 42% for 2003. Income
taxes of the overseas consolidated subsidiaries are based generally on the tax rates applicable in their countries of incorporation.
The effective tax rates reflected in the consolidated statements of income for the years ended March 31, 2006, 2005 and 2004 differ from
the statutory tax rates for the following reasons:
2005 2004 2003
For the years ended Mar. 31, 2006 Mar. 31, 2005 Mar. 31, 2004
Statutory tax rates ................................................................................................................................................................................................................. 40.6% 40.6% 41.9%
Effect of:
Decrease in valuation allowance................................................................................................................................................................ (1.0) (1.9) (5.5)
Different tax rates applied to overseas subsidiaries .................................................................................................................. (3.1) (2.7) (4.3)
Tax credits..................................................................................................................................................................................................................... (2.7) (1.5) (2.0)
Equity in earnings of unconsolidated subsidiaries and affiliates...................................................................................... (1.9) (1.9) (0.6)
Other.................................................................................................................................................................................................................................. (0.5) (0.1) 0.2
Effective tax rates.................................................................................................................................................................................................................. 31.4% 32.5% 29.7%
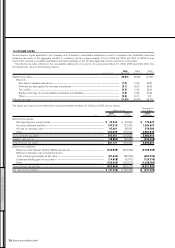
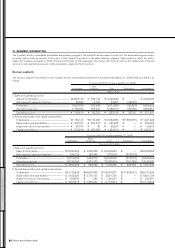
The significant components of deferred tax assets and liabilities at March 31, 2006 and 2005 were as follows:
Thousands of
Millions of yen U.S. dollars
2005 2004 2005
As of Mar. 31, 2006 Mar. 31, 2005 Mar. 31, 2006
Deferred tax assets:
Net operating loss carryforwards................................................................................................................................ ¥ 20,343 ¥ 24,660 $ 173,872
Accrued retirement benefits............................................................................................................................................ 157,319 172,379 1,344,607
Accrual for warranty costs ................................................................................................................................................ 67,461 38,047 576,590
Other................................................................................................................................................................................................... 454,878 379,543 3,887,846
Gross deferred tax assets.......................................................................................................................................................... 700,001 614,629 5,982,915
Valuation allowance......................................................................................................................................................................... (38,880) (36,369) (332,308)
Total deferred tax assets ............................................................................................................................................................ 661,121 578,260 5,650,607
Deferred tax liabilities:
Reserves under Special Taxation Measures Law, etc. .............................................................................. (440,939) (379,924) (3,768,709)
Difference between cost of investments and
their underlying net equity at fair value ............................................................................................................... (81,634) (88,840) (697,726)
Unrealized holding gain on securities...................................................................................................................... (14,828) (5,971) (126,735)
Other................................................................................................................................................................................................... (155,465) (128,577) (1,328,762)
Total deferred tax liabilities ....................................................................................................................................................... (692,866) (603,312) (5,921,932)
Net deferred tax liabilities........................................................................................................................................................... ¥ (31,745) ¥ (25,052) $ (271,325)