Nissan 2006 Annual Report Download - page 32
Download and view the complete annual report
Please find page 32 of the 2006 Nissan annual report below. You can navigate through the pages in the report by either clicking on the pages listed below, or by using the keyword search tool below to find specific information within the annual report.-
 1
1 -
2
-
3
-
4
-
5
-
6
-
7
-
8
-
9
-
10
-
11
-
12
-
13
-
14
-
15
-
16
-
17
-
18
-
19
-
20
-
21
-
 22
22 -
 23
23 -
 24
24 -
 25
25 -
 26
26 -
 27
27 -
 28
28 -
 29
29 -
 30
30 -
 31
31 -
 32
32 -
 33
33 -
 34
34 -
 35
35 -
 36
36 -
 37
37 -
 38
38 -
 39
39 -
 40
40 -
 41
41 -
 42
42 -
43
-
44
-
45
-
46
-
47
-
48
-
49
-
50
-
51
-
52
-
53
-
54
-
55
-
56
-
57
-
58
-
59
-
60
-
61
-
62
-
63
-
64
-
65
-
66
-
67
-
68
-
69
-
70
-
71
-
72
-
73
-
74
-
75
-
76
-
77
-
78
-
79
-
80
-
81
-
82
-
83
-
84
-
85
-
86
-
87
-
88
-
89
-
90
-
91
-
92
-
93
-
94
-
95
-
96
-
97
-
98
-
99
-
100
-
101
-
102
 |
 |
Nissan Annual Report 2005
30
40
50
30
20
10
0’00 ’01 ’02 ’03 ’04 ’05 ’06* ’07*
FY
’99
*Forecast
0
14
24
34
40
78
19
NRP Nissan 180 Nissan
Value-Up
29
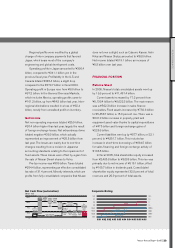
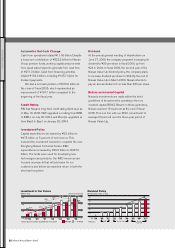
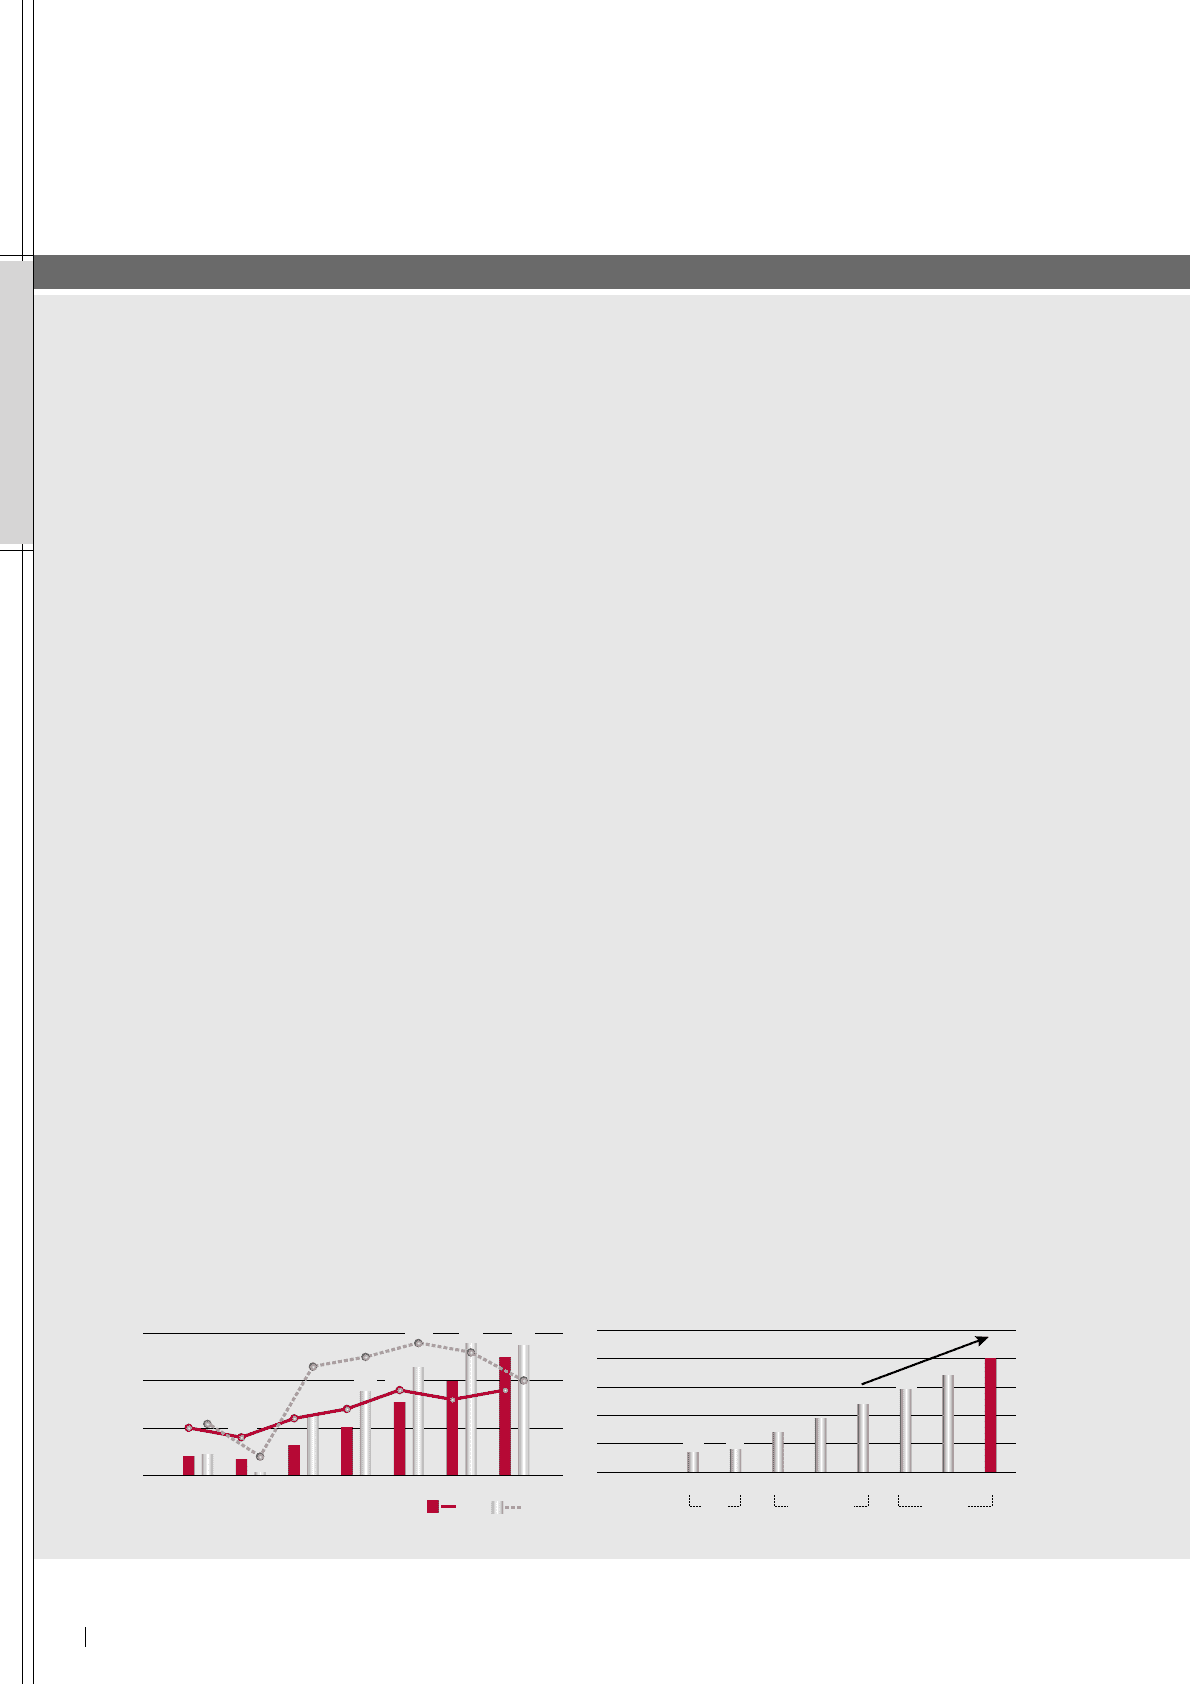
Dividend Policy
(Dividend per share, in yen)
Automotive Net Cash Change
Cash from operations totaled ¥1,106 billion. Despite
a lump-sum contribution of ¥222.2 billion to Nissan
Group pension funds, working capital and proceeds
from asset sales helped to generate free cash flow
of ¥271.3 billion. Cash from financing activities
totaled ¥154.2 billion, including ¥105.7 billion for
dividend payments.
We had a net cash position of ¥372.9 billion at
the close of fiscal 2005, which represented an
improvement of ¥167.1 billion compared to the
beginning of the fiscal year.
Credit Rating
R&I had Nissan’s long-term credit rating listed as A as
of May 16, 2006. S&P upgraded our rating from BBB
to BBB+ on July 20, 2004, and Moody’s upgraded us
from Baa3 to Baa1 on January 29, 2004.
Investment Policy
Capital expenditures decreased by ¥2.5 billion to
¥475 billion, or 5 percent of net revenue. This
included the investment needed to complete the new
Dongfeng Nissan Technical Center. R&D
expenditures increased by ¥49.5 billion to ¥447.6
billion. The funds were used for developing new
technologies and products. Our R&D resources are
focused on projects that will add value for our
customers and deliver an expected return in both the
short and long term.
Dividend
At the annual general meeting of shareholders on
June 27, 2006, the company proposed increasing its
dividend to ¥29 per share in fiscal 2005, up from
¥24 in 2004. In fiscal 2006, the second year of the
Nissan Value-Up dividend policy, the company plans
to increase dividend per share to ¥34. By the end of
Nissan Value-Up in March 2008, Nissan intends to
pay an annual dividend of no less than ¥40 per share.
Return on Invested Capital
Nissan’s investments are made within the strict
guidelines of its automotive operating return on
invested capital (ROIC). Based on these guidelines,
Nissan reached 19.4 percent at the end of fiscal
2005. This is in line with our ROIC commitment to
average 20 percent over the three-year period of
Nissan Value-Up.
Canton plant investment included from fiscal 2001
239244 232
206
262
326
300
378
354
427
398
478
4.0% 3.8%
5.3% 5.5%
5.8%
5.6%
4.2% 4.4%
4.8%
4.6%
448
475
5.0%
4.8%
3.4%
4.1%
500
400
300
200
6
5
4
3
’99 ’00 ’01 ’02 ’03 ’04 ’05
FY
R&D CAPEX
Investment in Our Future
(Billion Yen) (% of net revenue)
PERFORMANCE