NetFlix 2011 Annual Report Download - page 74
Download and view the complete annual report
Please find page 74 of the 2011 NetFlix annual report below. You can navigate through the pages in the report by either clicking on the pages listed below, or by using the keyword search tool below to find specific information within the annual report.-
 1
1 -
2
-
3
-
4
-
5
-
6
-
7
-
8
-
9
-
10
-
11
-
12
-
13
-
14
-
15
-
16
-
17
-
18
-
19
-
20
-
21
-
22
-
23
-
24
-
25
-
26
-
27
-
28
-
29
-
30
-
31
-
32
-
33
-
34
-
35
-
36
-
37
-
38
-
39
-
40
-
41
-
42
-
43
-
44
-
45
-
46
-
47
-
48
-
49
-
50
-
51
-
52
-
53
-
54
-
55
-
56
-
57
-
58
-
59
-
60
-
61
-
62
-
63
-
 64
64 -
 65
65 -
 66
66 -
 67
67 -
 68
68 -
 69
69 -
 70
70 -
 71
71 -
 72
72 -
 73
73 -
 74
74 -
 75
75 -
 76
76 -
 77
77 -
 78
78 -
 79
79 -
 80
80 -
 81
81 -
 82
82
 |
 |

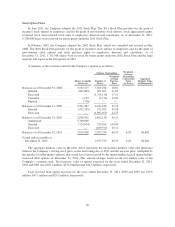
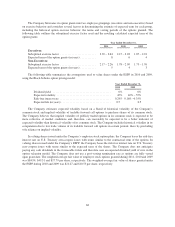
The following table represents segment information for the fourth quarter of 2011:
As of/Three Months ended December 31, 2011
Domestic
Streaming
International
Streaming
Domestic
DVD Consolidated
(in thousands)
Total subscriptions at end of period ......... 21,671 1,858 11,165 —
Revenues .............................. $476,334 $ 28,988 $370,253 $875,575
Cost of revenues and marketing expense ..... 424,224 88,731 176,488 689,443
Contribution profit (loss) .............. $ 52,110 $(59,743) $193,765 186,132
Other operating expenses ................. 124,260
Operating income ................... 61,872
Other income (expense) .................. (5,037)
Provision for income taxes ................ 21,616
Net income ........................ $ 35,219
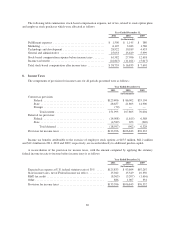
The following tables represent the Company’s segment information for the years ended December 31, 2011
and 2010 based on the Company’s segment reporting prior to the fourth quarter of 2011:
As of/Year ended December 31, 2011
Domestic International Consolidated
(in thousands)
Total unique subscribers at end of period .............. 24,395 1,858 26,253
Revenues ....................................... $3,121,727 $ 82,850 $3,204,577
Cost of revenues and marketing expense .............. 2,256,540 185,999 2,442,539
Contribution profit (loss) ...................... $ 865,187 $(103,149) 762,038
Other operating expenses .......................... 385,970
Operating income ............................ 376,068
Other income (expense) ........................... (16,546)
Provision for income taxes ......................... 133,396
Net income ................................. $ 226,126
As of/Year ended December 31, 2010
Domestic International Consolidated
(in thousands)
Total unique subscribers at end of period .............. 19,501 509 20,010
Revenues ....................................... $2,159,008 $ 3,617 $2,162,625
Cost of revenues and marketing expense .............. 1,635,459 15,735 1,651,194
Contribution profit (loss) ...................... $ 523,549 $ (12,118) 511,431
Other operating expenses .......................... 227,790
Operating income ............................ 283,641
Other income (expense) ........................... (15,945)
Provision for income taxes ......................... 106,843
Net income ................................. $ 160,853
72