NetFlix 2011 Annual Report Download - page 24
Download and view the complete annual report
Please find page 24 of the 2011 NetFlix annual report below. You can navigate through the pages in the report by either clicking on the pages listed below, or by using the keyword search tool below to find specific information within the annual report.-
 1
1 -
2
-
3
-
4
-
5
-
6
-
7
-
8
-
9
-
10
-
11
-
12
-
13
-
 14
14 -
 15
15 -
 16
16 -
 17
17 -
 18
18 -
 19
19 -
 20
20 -
 21
21 -
 22
22 -
 23
23 -
 24
24 -
 25
25 -
 26
26 -
 27
27 -
 28
28 -
 29
29 -
 30
30 -
 31
31 -
 32
32 -
 33
33 -
 34
34 -
35
-
36
-
37
-
38
-
39
-
40
-
41
-
42
-
43
-
44
-
45
-
46
-
47
-
48
-
49
-
50
-
51
-
52
-
53
-
54
-
55
-
56
-
57
-
58
-
59
-
60
-
61
-
62
-
63
-
64
-
65
-
66
-
67
-
68
-
69
-
70
-
71
-
72
-
73
-
74
-
75
-
76
-
77
-
78
-
79
-
80
-
81
-
82
 |
 |

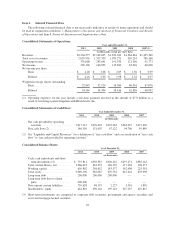
Item 6. Selected Financial Data
The following selected financial data is not necessarily indicative of results of future operations and should
be read in conjunction with Item 7, Management’s Discussion and Analysis of Financial Condition and Results
of Operations and Item 8, Financial Statements and Supplementary Data.
Consolidated Statements of Operations:
Year ended December 31,
2011 2010 2009 2008 2007 (1)
(in thousands, except per share data)
Revenues ............................ $3,204,577 $2,162,625 $1,670,269 $1,364,661 $1,205,340
Total cost of revenues .................. 2,039,901 1,357,355 1,079,271 910,234 786,168
Operating income ..................... 376,068 283,641 191,939 121,506 91,773
Net income .......................... 226,126 160,853 115,860 83,026 66,608
Net income per share:
Basic ........................... $ 4.28 $ 3.06 $ 2.05 $ 1.36 $ 0.99
Diluted .......................... $ 4.16 $ 2.96 $ 1.98 $ 1.32 $ 0.97
Weighted-average shares outstanding:
Basic ........................... 52,847 52,529 56,560 60,961 67,076
Diluted .......................... 54,369 54,304 58,416 62,836 68,902
(1) Operating expenses for the year include a one-time payment received in the amount of $7.0 million as a
result of resolving a patent litigation with Blockbuster, Inc.
Consolidated Statements of Cash Flows:
Year Ended December 31,
2011 2010 2009 2008 2007
(in thousands)
Net cash provided by operating
activities ..................... $317,712 $276,401 $325,063 $284,037 $277,420
Free cash flow (2) ................ 186,550 131,007 97,122 94,700 45,889
(2) See “Liquidity and Capital Resources” for a definition of “free cash flow” and a reconciliation of “free cash
flow” to “net cash provided by operating activities.”
Consolidated Balance Sheets:
As of December 31,
2011 2010 2009 2008 2007
(in thousands)
Cash, cash equivalents and short-
term investments (3) .......... $ 797,811 $350,387 $320,242 $297,271 $385,142
Total content library, net ......... 1,966,643 361,979 146,139 117,238 128,371
Working capital ................ 605,802 248,652 183,577 142,908 223,518
Total assets ................... 3,069,196 982,067 679,734 615,424 678,998
Long-term debt ................ 200,000 200,000 200,000 — —
Long-term debt due to related
party ....................... 200,000 ————
Non-current content liabilities ..... 739,628 48,179 2,227 3,516 1,850
Stockholders’ equity ............ 642,810 290,164 199,143 347,155 429,812
(3) Short-term investments are comprised of corporate debt securities, government and agency securities and
asset and mortgage-backed securities.
22