NetFlix 2011 Annual Report Download - page 26
Download and view the complete annual report
Please find page 26 of the 2011 NetFlix annual report below. You can navigate through the pages in the report by either clicking on the pages listed below, or by using the keyword search tool below to find specific information within the annual report.-
 1
1 -
2
-
3
-
4
-
5
-
6
-
7
-
8
-
9
-
10
-
11
-
12
-
13
-
14
-
15
-
 16
16 -
 17
17 -
 18
18 -
 19
19 -
 20
20 -
 21
21 -
 22
22 -
 23
23 -
 24
24 -
 25
25 -
 26
26 -
 27
27 -
 28
28 -
 29
29 -
 30
30 -
 31
31 -
 32
32 -
 33
33 -
 34
34 -
 35
35 -
 36
36 -
37
-
38
-
39
-
40
-
41
-
42
-
43
-
44
-
45
-
46
-
47
-
48
-
49
-
50
-
51
-
52
-
53
-
54
-
55
-
56
-
57
-
58
-
59
-
60
-
61
-
62
-
63
-
64
-
65
-
66
-
67
-
68
-
69
-
70
-
71
-
72
-
73
-
74
-
75
-
76
-
77
-
78
-
79
-
80
-
81
-
82
 |
 |

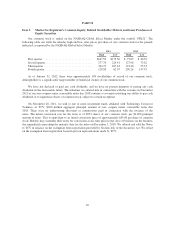
As a result of the changes to our pricing and plan structure, we no longer offer a single subscription plan
including both DVD-by-mail and streaming in the U.S. Domestic subscribers who wish to receive DVDs-by-mail
and watch streaming content must elect both a DVD-by-mail subscription plan and a streaming subscription plan.
Accordingly, beginning with the third quarter of 2011, management views the number of paid subscriptions as
the key driver of revenues. The following metrics reflect these changes.
As of /Year Ended December 31,
2011 2010 2009
(in thousands)
Domestic streaming:
Paid subscriptions at end of period ......................... 20,153
Total subscriptions at end of period ......................... 21,671
International streaming:
Net additions .......................................... 1,349 509 —
Paid subscriptions at end of period ......................... 1,447 333 —
Total subscriptions at end of period ......................... 1,858 509 —
Domestic DVD:
Paid subscriptions at end of period ......................... 11,039
Total subscriptions at end of period ......................... 11,165
Total domestic:
Net unique subscriber additions during period (1) .............. 4,894 7,233 2,878
Total domestic unique subscribers at end of period (1) .......... 24,395 19,501 12,268
Churn (2) ............................................. 4.9% 3.8% 4.3%
Consolidated:
Net unique subscriber additions during period (1) .............. 6,243 7,742 2,878
Paid unique subscribers at end of period (1) .................. 24,305 18,268 11,892
Total unique subscribers at end of period (1) .................. 26,253 20,010 12,268
(1) For purposes of determining the number of unique subscribers, domestic subscribers who have elected both
a DVD and a streaming subscription plan are considered a single unique subscriber.
(2) Churn is a monthly measure defined as customer cancellations in the quarter divided by the sum of
beginning subscribers and gross subscriber additions, then divided by three months. Churn (annualized) is
the average of churn for the four quarters of each respective year.
As we evolve our focus from our DVD to streaming service, we will be slightly changing how we treat our
domestic subscribers so that they are in line with our international subscribers. Beginning in the first quarter of
2012, domestic members who are on payment holds will no longer be counted as unique subscribers nor will they
be included in our subscription metrics. Members who cancel mid-period will continue to receive service until
the end of the period and will accordingly be counted as subscribers and in our subscription metrics until the end
of the period. These changes may impact our subscription metrics but we do not expect such impacts to be
material. There is no effect on revenue from these changes.
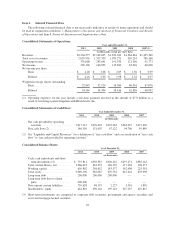
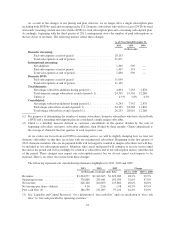
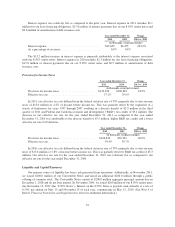
The following represents our consolidated performance highlights for 2011, 2010 and 2009:
2011 2010 2009 Change
(in thousands, except per share data) 2011 vs. 2010 2010 vs. 2009
Revenues ............................ $3,204,577 $2,162,625 $1,670,269 48.2% 29.5%
Operating income ..................... 376,068 283,641 191,939 32.6% 47.8%
Net income .......................... 226,126 160,853 115,860 40.6% 38.8%
Net income per share—diluted ........... 4.16 2.96 1.98 40.5% 49.5%
Free cash flow (3) ..................... 186,550 131,007 97,122 42.4% 34.9%
(3) See “Liquidity and Capital Resources” for a definition of “free cash flow” and a reconciliation of “free cash
flow” to “net cash provided by operating activities.”
24