NetFlix 2011 Annual Report Download - page 51
Download and view the complete annual report
Please find page 51 of the 2011 NetFlix annual report below. You can navigate through the pages in the report by either clicking on the pages listed below, or by using the keyword search tool below to find specific information within the annual report.-
 1
1 -
2
-
3
-
4
-
5
-
6
-
7
-
8
-
9
-
10
-
11
-
12
-
13
-
14
-
15
-
16
-
17
-
18
-
19
-
20
-
21
-
22
-
23
-
24
-
25
-
26
-
27
-
28
-
29
-
30
-
31
-
32
-
33
-
34
-
35
-
36
-
37
-
38
-
39
-
40
-
 41
41 -
 42
42 -
 43
43 -
 44
44 -
 45
45 -
 46
46 -
 47
47 -
 48
48 -
 49
49 -
 50
50 -
 51
51 -
 52
52 -
 53
53 -
 54
54 -
 55
55 -
 56
56 -
 57
57 -
 58
58 -
 59
59 -
 60
60 -
 61
61 -
62
-
63
-
64
-
65
-
66
-
67
-
68
-
69
-
70
-
71
-
72
-
73
-
74
-
75
-
76
-
77
-
78
-
79
-
80
-
81
-
82
 |
 |

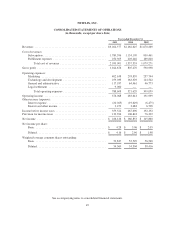
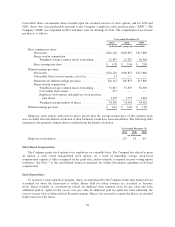
NETFLIX, INC.
CONSOLIDATED STATEMENTS OF OPERATIONS
(in thousands, except per share data)
Year ended December 31,
2011 2010 2009
Revenues .................................................. $3,204,577 $2,162,625 $1,670,269
Cost of revenues:
Subscription ............................................ 1,789,596 1,154,109 909,461
Fulfillment expenses ..................................... 250,305 203,246 169,810
Total cost of revenues ................................ 2,039,901 1,357,355 1,079,271
Gross profit ................................................ 1,164,676 805,270 590,998
Operating expenses:
Marketing ............................................. 402,638 293,839 237,744
Technology and development .............................. 259,033 163,329 114,542
General and administrative ................................ 117,937 64,461 46,773
Legal settlement ........................................ 9,000 — —
Total operating expenses .............................. 788,608 521,629 399,059
Operating income ........................................... 376,068 283,641 191,939
Other income (expense):
Interest expense ......................................... (20,025) (19,629) (6,475)
Interest and other income ................................. 3,479 3,684 6,728
Income before income taxes ................................... 359,522 267,696 192,192
Provision for income taxes .................................... 133,396 106,843 76,332
Net income ................................................ $ 226,126 $ 160,853 $ 115,860
Net income per share:
Basic ................................................. $ 4.28 $ 3.06 $ 2.05
Diluted ................................................ $ 4.16 $ 2.96 $ 1.98
Weighted-average common shares outstanding:
Basic ................................................. 52,847 52,529 56,560
Diluted ................................................ 54,369 54,304 58,416
See accompanying notes to consolidated financial statements.
49