NetFlix 2011 Annual Report Download - page 32
Download and view the complete annual report
Please find page 32 of the 2011 NetFlix annual report below. You can navigate through the pages in the report by either clicking on the pages listed below, or by using the keyword search tool below to find specific information within the annual report.-
 1
1 -
2
-
3
-
4
-
5
-
6
-
7
-
8
-
9
-
10
-
11
-
12
-
13
-
14
-
15
-
16
-
17
-
18
-
19
-
20
-
21
-
 22
22 -
 23
23 -
 24
24 -
 25
25 -
 26
26 -
 27
27 -
 28
28 -
 29
29 -
 30
30 -
 31
31 -
 32
32 -
 33
33 -
 34
34 -
 35
35 -
 36
36 -
 37
37 -
 38
38 -
 39
39 -
 40
40 -
 41
41 -
 42
42 -
43
-
44
-
45
-
46
-
47
-
48
-
49
-
50
-
51
-
52
-
53
-
54
-
55
-
56
-
57
-
58
-
59
-
60
-
61
-
62
-
63
-
64
-
65
-
66
-
67
-
68
-
69
-
70
-
71
-
72
-
73
-
74
-
75
-
76
-
77
-
78
-
79
-
80
-
81
-
82
 |
 |

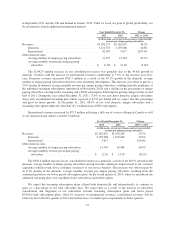
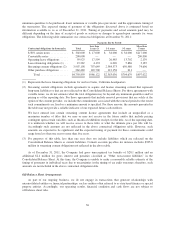
coupled with an increase in payments to our affiliates. Approximately half of these increases were incurred in our
International segments in large part due to our launch in Latin America and the Caribbean. These increases were
partially offset by a decrease in direct mail and inserts, and payments made to our consumer electronics partners.
The increase in marketing program spending was partially offset by decreases in the costs of free trials.
Year ended December 31, Change
2010 2009 2010 vs. 2009
(in thousands, except percentages and
subscriber acquisition cost)
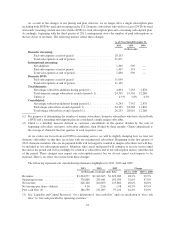
Marketing .................................... $293,839 $237,744 23.6%
As a percentage of revenues .................. 13.6% 14.2%
Other domestic data:
Gross unique subscriber additions ............. 15,648 9,332 67.7%
Subscriber acquisition cost ................... $ 18.21 $ 25.48 (28.5)%
The $56.1 million increase in marketing expenses was primarily attributable to an increase of $17.4 million
in domestic spending related to our consumer electronics partners, as we continued to expand the number of
devices on which subscribers can view Netflix content. The increase is also due to a $16.2 million increase in
other marketing program spending, principally in TV and radio advertising to promote our service, offset by a
decrease in direct mail and inserts. In addition, costs of free trials increased $21.0 million due to the 67.7%
increase in domestic gross unique subscriber additions, coupled with shipments of instant streaming discs which
enable subscribers to stream content to certain consumer electronic devices and the expanded use of one month
free trials. Subscriber acquisition cost decreased primarily due to continued strong organic subscriber growth.
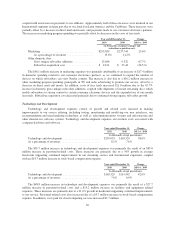
Technology and Development
Technology and development expenses consist of payroll and related costs incurred in making
improvements to our service offering, including testing, maintaining and modifying our user interfaces, our
recommendation and merchandising technology, as well as, telecommunications systems and infrastructure and
other internal-use software systems. Technology and development expenses also include costs associated with
computer hardware and software.
Year ended December 31, Change
2011 2010 2011 vs. 2010
(in thousands, except percentages)
Technology and development .......................... $259,033 $163,329 58.6%
As a percentage of revenues ........................... 8.1% 7.6%
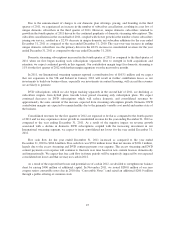
The $95.7 million increase in technology and development expenses was primarily the result of an $83.0
million increase in personnel-related costs. These increases are primarily due to a 54% growth in average
headcount supporting continued improvements in our streaming service and international expansion, coupled
with an $18.7 million increase in stock-based compensation expense.
Year ended December 31, Change
2010 2009 2010 vs. 2009
(in thousands, except percentages)
Technology and development .......................... $163,329 $114,542 42.6%
As a percentage of revenues ........................... 7.6% 6.9%
The $48.8 million increase in technology and development expenses was primarily the result of a $27.7
million increase in personnel-related costs and a $14.2 million increase in facilities and equipment related
expenses. These increases are primarily due to a 21.0% growth in headcount supporting continued improvements
to our service. Personnel-related costs also increased due to a $5.7 million increase in stock-based compensation
expense. In addition, costs paid for cloud computing services increased $7.7 million.
30