NetFlix 2011 Annual Report Download - page 36
Download and view the complete annual report
Please find page 36 of the 2011 NetFlix annual report below. You can navigate through the pages in the report by either clicking on the pages listed below, or by using the keyword search tool below to find specific information within the annual report.-
 1
1 -
2
-
3
-
4
-
5
-
6
-
7
-
8
-
9
-
10
-
11
-
12
-
13
-
14
-
15
-
16
-
17
-
18
-
19
-
20
-
21
-
22
-
23
-
24
-
25
-
 26
26 -
 27
27 -
 28
28 -
 29
29 -
 30
30 -
 31
31 -
 32
32 -
 33
33 -
 34
34 -
 35
35 -
 36
36 -
 37
37 -
 38
38 -
 39
39 -
 40
40 -
 41
41 -
 42
42 -
 43
43 -
 44
44 -
 45
45 -
 46
46 -
47
-
48
-
49
-
50
-
51
-
52
-
53
-
54
-
55
-
56
-
57
-
58
-
59
-
60
-
61
-
62
-
63
-
64
-
65
-
66
-
67
-
68
-
69
-
70
-
71
-
72
-
73
-
74
-
75
-
76
-
77
-
78
-
79
-
80
-
81
-
82
 |
 |

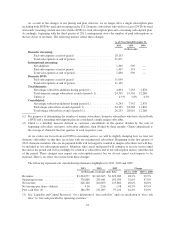
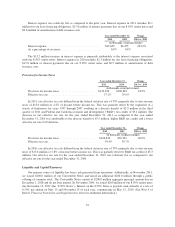
repurchases of our common stock decreased by $10.6 million. These increases were partially offset by a $30.2
million decrease in proceeds from the issuance of common stock upon exercise of options and a $16.4 million
decrease in excess tax benefits from stock-based compensation expense.
Year Ended December 31, Change
2010 2009 2010 vs. 2009
(in thousands, except percentages)
Cash and cash equivalents ........................... $194,499 $ 134,224 44.9%
Short-term investments .............................. 155,888 186,018 (16.2)%
$ 350,387 $ 320,242 9.4%
Net cash provided by operating activities ............... $276,401 $ 325,063 (15.0)%
Net cash used in investing activities .................... $(116,081) $(246,079) (52.8)%
Net cash used in financing activities ................... $(100,045) $ (84,641) 18.2%
Cash provided by operating activities decreased by $48.7 million or 15.0%, primarily due to increased
payments for content acquisition and licensing other than DVD library of $267.8 million. This increase was
coupled with increased payroll expenses, payments for advertising and affiliates transactions, credit card fees,
content delivery expenses and excess tax benefits from stock-based compensation. The increase in these expenses
was partially offset by an increase in subscription revenues of $492.4 million resulting from a 40.9% increase in
the domestic average number of paying subscribers.
Cash used in investing activities decreased $130.0 million or 52.8%, primarily due to a $54.9 million
decrease in the purchases, net of proceeds, of short-term investments and a $69.1 million decrease in acquisitions
of DVD content library, as more DVDs were obtained through revenue sharing arrangements. In addition,
purchases of property and equipment decreased by $12.1 million, as a significant amount of payments for
automation equipment for our various shipping centers were made in 2009.
Cash used in financing activities increased $15.4 million or 18.2%, primarily due to the $193.9 million net
proceeds received from the issuance of our 8.50% Notes in 2009. This decrease was partially offset by a $114.1
million decrease in repurchases of our common stock coupled with a $49.5 million increase in the excess tax
benefits from stock-based compensation expense and a $14.5 million increase in proceeds from the issuance of
common stock upon exercise of options.
Free Cash Flow
We define free cash flow as cash provided by operating and investing activities excluding the
non-operational cash flows from purchases, maturities and sales of short-term investments and cash flows from
investments in businesses. We believe free cash flow is an important liquidity metric because it measures, during
a given period, the amount of cash generated that is available to repay debt obligations, make investments,
repurchase our stock and for certain other activities. Free cash flow is considered a non-GAAP financial measure
and should not be considered in isolation of, or as a substitute for, net income, operating income, cash flow from
operating activities, or any other measure of financial performance or liquidity presented in accordance with
GAAP.
In comparing free cash flow to net income, the major recurring differences are excess streaming and DVD
payments over expenses, stock-based compensation expense, deferred revenue, taxes and semi-annual interest
payments on the 8.50% Notes. Because consumers use credit cards to buy from us, our receivables from
customers settle quickly and deferred revenue is a source of cash flow. For streaming content, we typically enter
into multi-year licenses with studios and other distributors that may result in an increase in content library and a
corresponding increase in liabilities in the Consolidated Balance Sheet. The payment terms for these license fees
may extend over the term of the license agreements, which typically range from six months to five years. License
34