NetFlix 2011 Annual Report Download - page 59
Download and view the complete annual report
Please find page 59 of the 2011 NetFlix annual report below. You can navigate through the pages in the report by either clicking on the pages listed below, or by using the keyword search tool below to find specific information within the annual report.-
 1
1 -
2
-
3
-
4
-
5
-
6
-
7
-
8
-
9
-
10
-
11
-
12
-
13
-
14
-
15
-
16
-
17
-
18
-
19
-
20
-
21
-
22
-
23
-
24
-
25
-
26
-
27
-
28
-
29
-
30
-
31
-
32
-
33
-
34
-
35
-
36
-
37
-
38
-
39
-
40
-
41
-
42
-
43
-
44
-
45
-
46
-
47
-
48
-
 49
49 -
 50
50 -
 51
51 -
 52
52 -
 53
53 -
 54
54 -
 55
55 -
 56
56 -
 57
57 -
 58
58 -
 59
59 -
 60
60 -
 61
61 -
 62
62 -
 63
63 -
 64
64 -
 65
65 -
 66
66 -
 67
67 -
 68
68 -
 69
69 -
70
-
71
-
72
-
73
-
74
-
75
-
76
-
77
-
78
-
79
-
80
-
81
-
82
 |
 |

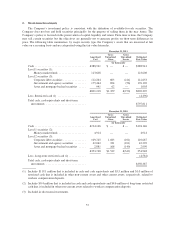
2. Short-term Investments
The Company’s investment policy is consistent with the definition of available-for-sale securities. The
Company does not buy and hold securities principally for the purpose of selling them in the near future. The
Company’s policy is focused on the preservation of capital, liquidity and return. From time to time, the Company
may sell certain securities but the objectives are generally not to generate profits on short-term differences in
price. The following table summarizes, by major security type, the Company’s assets that are measured at fair
value on a recurring basis and are categorized using the fair value hierarchy.
December 31, 2011
Amortized
Cost
Gross
Unrealized
Gains
Gross
Unrealized
Losses
Estimated
Fair Value
(in thousands)
Cash .................................... $388,941 $ — $ — $388,941
Level 1 securities (1):
Money market funds ................... 123,608 — — 123,608
Level 2 securities (3):
Corporate debt securities ................ 112,264 603 (214) 112,653
Government and agency securities ........ 175,464 694 (56) 176,102
Asset and mortgage-backed securities ..... 941 62 — 1,003
$801,218 $1,359 $(270) $802,307
Less: Restricted cash (1) .................... (4,496)
Total cash, cash equivalents and short-term
investments ............................ $797,811
December 31, 2010
Amortized
Cost
Gross
Unrealized
Gains
Gross
Unrealized
Losses
Estimated
Fair Value
(in thousands)
Cash .................................... $194,146 $ — $ — $194,146
Level 1 securities (2):
Money market funds ................... 4,914 — — 4,914
Level 2 securities (3):
Corporate debt securities ................ 109,745 1,043 (101) 110,687
Government and agency securities ........ 42,062 331 (101) 42,292
Asset and mortgage-backed securities ..... 2,881 168 (140) 2,909
$353,748 $1,542 $(342) 354,948
Less: Long-term restricted cash (2) ............ (4,561)
Total cash, cash equivalents and short-term
investments ............................ $350,387
(1) Includes $119.1 million that is included in cash and cash equivalents and $3.5 million and $1.0 million of
restricted cash that is included in other non-current assets and other current assets, respectively, related to
workers compensation deposits.
(2) Includes $0.4 million that is included in cash and cash equivalents and $4.6 million of long-term restricted
cash that is included in other non-current assets related to workers compensation deposits.
(3) Included in short-term investments.
57