NetFlix 2011 Annual Report Download - page 50
Download and view the complete annual report
Please find page 50 of the 2011 NetFlix annual report below. You can navigate through the pages in the report by either clicking on the pages listed below, or by using the keyword search tool below to find specific information within the annual report.-
 1
1 -
2
-
3
-
4
-
5
-
6
-
7
-
8
-
9
-
10
-
11
-
12
-
13
-
14
-
15
-
16
-
17
-
18
-
19
-
20
-
21
-
22
-
23
-
24
-
25
-
26
-
27
-
28
-
29
-
30
-
31
-
32
-
33
-
34
-
35
-
36
-
37
-
38
-
39
-
 40
40 -
 41
41 -
 42
42 -
 43
43 -
 44
44 -
 45
45 -
 46
46 -
 47
47 -
 48
48 -
 49
49 -
 50
50 -
 51
51 -
 52
52 -
 53
53 -
 54
54 -
 55
55 -
 56
56 -
 57
57 -
 58
58 -
 59
59 -
 60
60 -
61
-
62
-
63
-
64
-
65
-
66
-
67
-
68
-
69
-
70
-
71
-
72
-
73
-
74
-
75
-
76
-
77
-
78
-
79
-
80
-
81
-
82
 |
 |

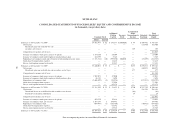
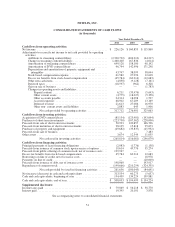
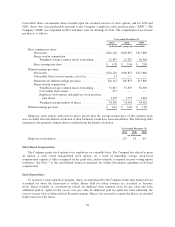
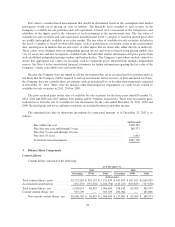
NETFLIX, INC.
CONSOLIDATED BALANCE SHEETS
(in thousands, except share and per share data)
As of December 31,
2011 2010
Assets
Current assets:
Cash and cash equivalents ............................................. $ 508,053 $194,499
Short-term investments ............................................... 289,758 155,888
Current content library, net ............................................ 919,709 181,006
Prepaid content ...................................................... 56,007 62,217
Other current assets .................................................. 57,330 43,621
Total current assets ............................................... 1,830,857 637,231
Non-current content library, net ............................................. 1,046,934 180,973
Property and equipment, net ................................................ 136,353 128,570
Other non-current assets ................................................... 55,052 35,293
Total assets ..................................................... $3,069,196 $982,067
Liabilities and Stockholders’ Equity
Current liabilities:
Content accounts payable .............................................. $ 924,706 $168,695
Other accounts payable ............................................... 87,860 54,129
Accrued expenses .................................................... 63,693 38,572
Deferred revenue .................................................... 148,796 127,183
Total current liabilities ............................................ 1,225,055 388,579
Long-term debt .......................................................... 200,000 200,000
Long-term debt due to related party .......................................... 200,000 —
Non-current content liabilities .............................................. 739,628 48,179
Other non-current liabilities ................................................ 61,703 55,145
Total liabilities .................................................. 2,426,386 691,903
Commitments and contingencies (Note 5)
Stockholders’ equity:
Preferred stock, $0.001 par value; 10,000,000 shares authorized at December 31,
2011 and 2010; no shares issued and outstanding at December 31, 2011 and
2010 ............................................................ — —
Common stock, $0.001 par value; 160,000,000 shares authorized at December 31,
2011 and 2010; 55,398,615 and 52,781,949 issued and outstanding at
December 31, 2011 and 2010, respectively .............................. 55 53
Additional paid-in capital .............................................. 219,119 51,622
Accumulated other comprehensive income ................................ 706 750
Retained earnings .................................................... 422,930 237,739
Total stockholders’ equity ......................................... 642,810 290,164
Total liabilities and stockholders’ equity .............................. $3,069,196 $982,067
See accompanying notes to consolidated financial statements.
48