NetFlix 2011 Annual Report Download - page 53
Download and view the complete annual report
Please find page 53 of the 2011 NetFlix annual report below. You can navigate through the pages in the report by either clicking on the pages listed below, or by using the keyword search tool below to find specific information within the annual report.-
 1
1 -
2
-
3
-
4
-
5
-
6
-
7
-
8
-
9
-
10
-
11
-
12
-
13
-
14
-
15
-
16
-
17
-
18
-
19
-
20
-
21
-
22
-
23
-
24
-
25
-
26
-
27
-
28
-
29
-
30
-
31
-
32
-
33
-
34
-
35
-
36
-
37
-
38
-
39
-
40
-
41
-
42
-
 43
43 -
 44
44 -
 45
45 -
 46
46 -
 47
47 -
 48
48 -
 49
49 -
 50
50 -
 51
51 -
 52
52 -
 53
53 -
 54
54 -
 55
55 -
 56
56 -
 57
57 -
 58
58 -
 59
59 -
 60
60 -
 61
61 -
 62
62 -
 63
63 -
64
-
65
-
66
-
67
-
68
-
69
-
70
-
71
-
72
-
73
-
74
-
75
-
76
-
77
-
78
-
79
-
80
-
81
-
82
 |
 |

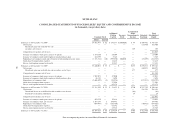
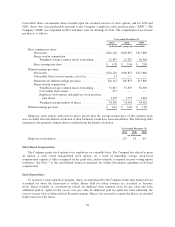
NETFLIX, INC.
CONSOLIDATED STATEMENTS OF CASH FLOWS
(in thousands)
Year Ended December 31,
2011 2010 2009
Cash flows from operating activities:
Net income ................................................. $ 226,126 $ 160,853 $ 115,860
Adjustments to reconcile net income to net cash provided by operating
activities:
Additions to streaming content library ........................ (2,320,732) (406,210) (64,217)
Change in streaming content liabilities ........................ 1,460,400 167,836 (4,014)
Amortization of streaming content library ..................... 699,128 158,100 48,192
Amortization of DVD content library ......................... 96,744 142,496 171,298
Depreciation and amortization of property, equipment and
intangibles ............................................ 43,747 38,099 38,044
Stock-based compensation expense .......................... 61,582 27,996 12,618
Excess tax benefits from stock-based compensation ............. (45,784) (62,214) (12,683)
Other non-cash items ...................................... (4,050) (9,128) (7,161)
Deferred taxes ........................................... (18,597) (962) 6,328
Gain on sale of business ................................... — — (1,783)
Changes in operating assets and liabilities: .....................
Prepaid content ...................................... 6,211 (35,476) (5,643)
Other current assets ................................... (4,775) (18,027) (5,358)
Other accounts payable ................................ 24,314 18,098 1,537
Accrued expenses .................................... 68,902 67,209 13,169
Deferred revenue ..................................... 21,613 27,086 16,970
Other non- current assets and liabilities ................... 2,883 645 1,906
Net cash provided by operating activities .............. 317,712 276,401 325,063
Cash flows from investing activities:
Acquisition of DVD content library .............................. (85,154) (123,901) (193,044)
Purchases of short-term investments .............................. (223,750) (107,362) (228,000)
Proceeds from sale of short-term investments ...................... 50,993 120,857 166,706
Proceeds from maturities of short-term investments ................. 38,105 15,818 35,673
Purchases of property and equipment ............................. (49,682) (33,837) (45,932)
Proceeds from sale of business .................................. — — 7,483
Other assets ................................................. 3,674 12,344 11,035
Net cash used in investing activities .................. (265,814) (116,081) (246,079)
Cash flows from financing activities:
Principal payments of lease financing obligations ................... (2,083) (1,776) (1,158)
Proceeds from issuance of common stock upon exercise of options ..... 19,614 49,776 35,274
Proceeds from public offering of common stock, net of issuance costs . . . 199,947 — —
Excess tax benefits from stock-based compensation ................. 45,784 62,214 12,683
Borrowings on line of credit, net of issuance costs ................... — — 18,978
Payments on line of credit ...................................... — — (20,000)
Proceeds from issuance of debt, net of issuance costs ................ 198,060 — 193,917
Repurchases of common stock .................................. (199,666) (210,259) (324,335)
Net cash provided by (used in) financing activities ...... 261,656 (100,045) (84,641)
Net increase (decrease) in cash and cash equivalents ................. 313,554 60,275 (5,657)
Cash and cash equivalents, beginning of year ...................... 194,499 134,224 139,881
Cash and cash equivalents, end of year ............................ $ 508,053 $ 194,499 $ 134,224
Supplemental disclosure:
Income taxes paid ............................................ $ 79,069 $ 56,218 $ 58,770
Interest paid ................................................. 19,395 20,101 3,878
See accompanying notes to consolidated financial statements.
51