NetFlix 2011 Annual Report Download - page 71
Download and view the complete annual report
Please find page 71 of the 2011 NetFlix annual report below. You can navigate through the pages in the report by either clicking on the pages listed below, or by using the keyword search tool below to find specific information within the annual report.-
 1
1 -
2
-
3
-
4
-
5
-
6
-
7
-
8
-
9
-
10
-
11
-
12
-
13
-
14
-
15
-
16
-
17
-
18
-
19
-
20
-
21
-
22
-
23
-
24
-
25
-
26
-
27
-
28
-
29
-
30
-
31
-
32
-
33
-
34
-
35
-
36
-
37
-
38
-
39
-
40
-
41
-
42
-
43
-
44
-
45
-
46
-
47
-
48
-
49
-
50
-
51
-
52
-
53
-
54
-
55
-
56
-
57
-
58
-
59
-
60
-
 61
61 -
 62
62 -
 63
63 -
 64
64 -
 65
65 -
 66
66 -
 67
67 -
 68
68 -
 69
69 -
 70
70 -
 71
71 -
 72
72 -
 73
73 -
 74
74 -
 75
75 -
 76
76 -
 77
77 -
 78
78 -
 79
79 -
 80
80 -
 81
81 -
82
 |
 |

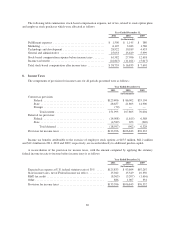
The following table summarizes stock-based compensation expense, net of tax, related to stock option plans
and employee stock purchases which were allocated as follows:
Year Ended December 31,
2011 2010 2009
(in thousands)
Fulfillment expenses .................................... $ 1,500 $ 1,145 $ 380
Marketing ............................................. 6,107 3,043 1,786
Technology and development ............................. 28,922 10,189 4,453
General and administrative ............................... 25,053 13,619 5,999
Stock-based compensation expense before income taxes ........ 61,582 27,996 12,618
Income tax benefit ...................................... (22,847) (11,161) (5,017)
Total stock-based compensation after income taxes ............ $38,735 $ 16,835 $ 7,601
8. Income Taxes
The components of provision for income taxes for all periods presented were as follows:
Year Ended December 31,
2011 2010 2009
(in thousands)
Current tax provision:
Federal .......................................... $123,406 $ 86,002 $55,104
State ............................................ 28,657 21,803 14,900
Foreign .......................................... (70) — —
Total current .................................. 151,993 107,805 70,004
Deferred tax provision:
Federal .......................................... (14,008) (1,615) 6,568
State ............................................ (4,589) 653 (240)
Total deferred ................................. (18,597) (962) 6,328
Provision for income taxes ............................... $133,396 $106,843 $76,332
Income tax benefits attributable to the exercise of employee stock options at $45.5 million, $62.2 million
and $12.4 million in 2011, 2010 and 2009, respectively, are recorded directly to additional paid-in-capital.
A reconciliation of the provision for income taxes, with the amount computed by applying the statutory
federal income tax rate to income before income taxes is as follows:
Year Ended December 31,
2011 2010 2009
(in thousands)
Expected tax expense at U.S. federal statutory rate of 35% ..... $125,833 $ 93,694 $67,267
State income taxes, net of Federal income tax effect ........... 15,042 15,349 10,350
R&D tax credit ........................................ (8,365) (3,207) (1,616)
Other ................................................ 886 1,007 331
Provision for income taxes ............................... $133,396 $106,843 $76,332
69