NetFlix 2011 Annual Report Download - page 30
Download and view the complete annual report
Please find page 30 of the 2011 NetFlix annual report below. You can navigate through the pages in the report by either clicking on the pages listed below, or by using the keyword search tool below to find specific information within the annual report.-
 1
1 -
2
-
3
-
4
-
5
-
6
-
7
-
8
-
9
-
10
-
11
-
12
-
13
-
14
-
15
-
16
-
17
-
18
-
19
-
 20
20 -
 21
21 -
 22
22 -
 23
23 -
 24
24 -
 25
25 -
 26
26 -
 27
27 -
 28
28 -
 29
29 -
 30
30 -
 31
31 -
 32
32 -
 33
33 -
 34
34 -
 35
35 -
 36
36 -
 37
37 -
 38
38 -
 39
39 -
 40
40 -
41
-
42
-
43
-
44
-
45
-
46
-
47
-
48
-
49
-
50
-
51
-
52
-
53
-
54
-
55
-
56
-
57
-
58
-
59
-
60
-
61
-
62
-
63
-
64
-
65
-
66
-
67
-
68
-
69
-
70
-
71
-
72
-
73
-
74
-
75
-
76
-
77
-
78
-
79
-
80
-
81
-
82
 |
 |

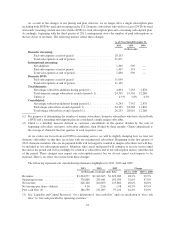
Cost of Revenues
Cost of revenues consists of cost of subscription revenues and fulfillment expenses.
Cost of subscription revenues consists of expenses related to the acquisition and licensing of content, as well
as content delivery costs related to providing streaming content and shipping DVDs to subscribers. Costs related
to free-trial periods are allocated to marketing expenses.
Content acquisition and licensing expenses consist primarily of amortization of streaming content licenses,
which may or may not be recognized in the streaming content library, as well as amortization of DVD content
library and revenue sharing expenses. We obtain content through streaming content license agreements, DVD
direct purchases and DVD revenue sharing agreements with studios, distributors and other suppliers. Content
agreements are made in the ordinary course of business and our business is not substantially dependent on any
particular agreement.
Content delivery expenses consist of the postage costs to mail DVDs to and from our paying subscribers, the
packaging and label costs for the mailers and all costs associated with streaming content over the Internet. We
utilize third-party content delivery networks to help us efficiently stream content in high volume to our
subscribers over the Internet.
Fulfillment expenses represent those expenses incurred in content processing, including operating and
staffing our shipping centers, as well as receiving, encoding, inspecting and warehousing our content library.
Fulfillment expenses also include operating and staffing our customer service centers and credit card fees.
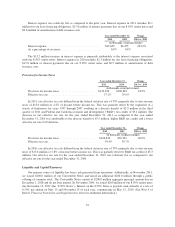
Year ended December 31, Change
2011 2010 2011 vs. 2010
(in thousands, except percentages)
Cost of subscription ............................... $1,789,596 $1,154,109 55.1%
Fulfillment expenses .............................. 250,305 203,246 23.2%
Total cost of revenues ......................... $2,039,901 $1,357,355 50.3%
As a percentage of revenues ........................ 63.7% 62.8%
The $682.5 million increase in cost of revenues was due to the following factors:
• Content acquisition and licensing expenses increased by $674.4 million. This increase was primarily
attributable to continued investments in streaming content resulting in an increase in the average number
of streaming content titles available for viewing to our domestic subscribers as compared to the prior
year. The increase is also partially attributed to an increase in streaming content titles available in Canada
as well as to our Latin America and Caribbean expansion in the second half of 2011.
• Content delivery expenses decreased $39.0 million primarily due to a 13.6% decrease in the number of
DVDs mailed to paying subscribers. The decrease in the number of DVDs mailed was driven by a 21.7%
decline in monthly DVD rentals per average paying DVD subscriber primarily attributed to the migration
of our DVD subscribers toward lower priced plans. The decrease in DVD delivery expenses was partially
offset by an increase in costs associated with our use of third-party delivery networks resulting from an
increase in the total number of hours of streaming content viewed by our subscribers. In the fourth
quarter of 2011, global streaming content hours viewed exceeded 2 billion.
• Fulfillment costs associated with content processing and customer service centers expenses increased
$16.2 million primarily due to a $22.3 million increase in costs associated with customer service call
centers to support our growing subscriber population both domestically and internationally, partially
offset by a $7.9 million decrease in hub operation expenses due to the 13.6% decrease in the number of
DVDs mailed to paying subscribers.
• Credit card fees increased $30.9 million as a result of the 48.2% growth in revenues.
28