NetFlix 2011 Annual Report Download - page 68
Download and view the complete annual report
Please find page 68 of the 2011 NetFlix annual report below. You can navigate through the pages in the report by either clicking on the pages listed below, or by using the keyword search tool below to find specific information within the annual report.-
 1
1 -
2
-
3
-
4
-
5
-
6
-
7
-
8
-
9
-
10
-
11
-
12
-
13
-
14
-
15
-
16
-
17
-
18
-
19
-
20
-
21
-
22
-
23
-
24
-
25
-
26
-
27
-
28
-
29
-
30
-
31
-
32
-
33
-
34
-
35
-
36
-
37
-
38
-
39
-
40
-
41
-
42
-
43
-
44
-
45
-
46
-
47
-
48
-
49
-
50
-
51
-
52
-
53
-
54
-
55
-
56
-
57
-
 58
58 -
 59
59 -
 60
60 -
 61
61 -
 62
62 -
 63
63 -
 64
64 -
 65
65 -
 66
66 -
 67
67 -
 68
68 -
 69
69 -
 70
70 -
 71
71 -
 72
72 -
 73
73 -
 74
74 -
 75
75 -
 76
76 -
 77
77 -
 78
78 -
79
-
80
-
81
-
82
 |
 |

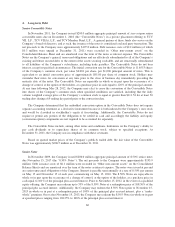
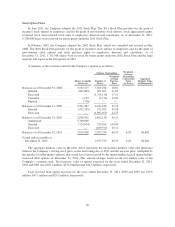
Stock Option Plans
In June 2011, the Company adopted the 2011 Stock Plan. The 2011 Stock Plan provides for the grant of
incentive stock options to employees and for the grant of non-statutory stock options, stock appreciation rights,
restricted stock and restricted stock units to employees, directors and consultants. As of December 31, 2011,
5,700,000 shares were reserved for future grants under the 2011 Stock Plan.
In February 2002, the Company adopted the 2002 Stock Plan, which was amended and restated in May
2006. The 2002 Stock Plan provides for the grant of incentive stock options to employees and for the grant of
non-statutory stock options and stock purchase rights to employees, directors and consultants. As of
December 31, 2011, 1,313,508 shares were reserved for future grants under the 2002 Stock Plan and the large
majority will expire in the first quarter of 2012.
A summary of the activities related to the Company’s options is as follows:
Shares Available
for Grant
Options Outstanding Weighted-
Average
Remaining
Contractual
Term
(in Years)
Aggregate
Intrinsic Value
(in Thousands)
Number of
Shares
Weighted-
Average
Exercise
Price
Balances as of December 31, 2008 ...... 3,192,515 5,365,016 18.81
Granted ........................ (601,665) 601,665 41.65
Exercised ...................... — (1,724,110) 17.11
Canceled ....................... 1,133 (1,133) 12.69
Expired ........................ (716) — —
Balances as of December 31, 2009 ...... 2,591,267 4,241,438 22.74
Granted ........................ (552,765) 552,765 99.58
Exercised ...................... — (1,902,073) 24.75
Balances as of December 31, 2010 ...... 2,038,502 2,892,130 36.11
Authorized ..................... 5,700,000 — —
Granted ........................ (724,994) 724,994 154.09
Exercised ...................... — (659,370) 29.11
Balances as of December 31, 2011 ...... 7,013,508 2,957,754 66.59 6.28 84,482
Vested and exercisable at
December 31, 2011 ................ 2,957,754 66.59 6.28 84,482
The aggregate intrinsic value in the table above represents the total pretax intrinsic value (the difference
between the Company’s closing stock price on the last trading day of 2011 and the exercise price, multiplied by
the number of in-the-money options) that would have been received by the option holders had all option holders
exercised their options on December 31, 2011. This amount changes based on the fair market value of the
Company’s common stock. Total intrinsic value of options exercised for the years ended December 31, 2011,
2010 and 2009 was $128.1 million, $176.0 million and $44.7 million, respectively.
Cash received from option exercises for the years ended December 31, 2011, 2010 and 2009 was $19.6
million, $47.1 million and $29.5 million, respectively.
66