Neiman Marcus 2012 Annual Report Download - page 99
Download and view the complete annual report
Please find page 99 of the 2012 Neiman Marcus annual report below. You can navigate through the pages in the report by either clicking on the pages listed below, or by using the keyword search tool below to find specific information within the annual report.-
 1
1 -
2
-
3
-
4
-
5
-
6
-
7
-
8
-
9
-
10
-
11
-
12
-
13
-
14
-
15
-
16
-
17
-
18
-
19
-
20
-
21
-
22
-
23
-
24
-
25
-
26
-
27
-
28
-
29
-
30
-
31
-
32
-
33
-
34
-
35
-
36
-
37
-
38
-
39
-
40
-
41
-
42
-
43
-
44
-
45
-
46
-
47
-
48
-
49
-
50
-
51
-
52
-
53
-
54
-
55
-
56
-
57
-
58
-
59
-
60
-
61
-
62
-
63
-
64
-
65
-
66
-
67
-
68
-
69
-
70
-
71
-
72
-
73
-
74
-
75
-
76
-
77
-
78
-
79
-
80
-
81
-
82
-
83
-
84
-
85
-
86
-
87
-
88
-
 89
89 -
 90
90 -
 91
91 -
 92
92 -
 93
93 -
 94
94 -
 95
95 -
 96
96 -
 97
97 -
 98
98 -
 99
99 -
 100
100 -
 101
101 -
 102
102 -
 103
103 -
 104
104 -
 105
105 -
 106
106 -
 107
107 -
 108
108 -
 109
109 -
110
-
111
-
112
-
113
-
114
-
115
-
116
-
117
-
118
-
119
-
120
-
121
-
122
-
123
-
124
-
125
-
126
-
127
-
128
-
129
-
130
-
131
-
132
-
133
-
134
-
135
-
136
-
137
-
138
-
139
-
140
-
141
-
142
-
143
-
144
-
145
-
146
-
147
-
148
-
149
-
150
-
151
-
152
-
153
-
154
-
155
-
156
-
157
-
158
-
159
-
160
-
161
-
162
-
163
-
164
-
165
-
166
-
167
-
168
-
169
-
170
-
171
-
172
-
173
-
174
-
175
-
176
-
177
 |
 |

Table of Contents
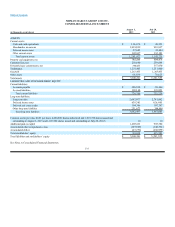
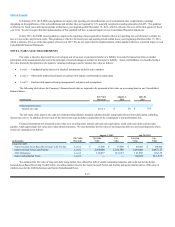
NEIMAN MARCUS GROUP LTD INC.
CONSOLIDATED BALANCE SHEETS
(in thousands, except shares)
August 3,
2013
July 28,
2012
ASSETS
Current assets:
Cash and cash equivalents $136,676 $49,253
Merchandise inventories 1,018,839 939,817
Deferred income taxes 27,645 22,484
Other current assets 102,817 132,181
Total current assets 1,285,977 1,143,735
Property and equipment, net 901,844 894,478
Customer lists, net 210,690 239,694
Favorable lease commitments, net 340,053 357,930
Tradenames 1,231,405 1,231,960
Goodwill 1,263,433 1,263,433
Other assets 66,839 70,625
Total assets $5,300,241 $5,201,855
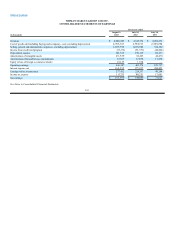
LIABILITIES AND STOCKHOLDERS’ EQUITY
Current liabilities:
Accounts payable $386,538 $331,408
Accrued liabilities 390,168 393,821
Total current liabilities 776,706 725,229
Long-term liabilities:
Long-term debt 2,697,077 2,781,882
Deferred income taxes 639,381 626,605
Deferred real estate credits 104,366 107,787
Other long-term liabilities 251,673 344,809
Total long-term liabilities 3,692,497 3,861,083
Common stock (par value $0.01 per share, 4,000,000 shares authorized and 1,019,728 shares issued and
outstanding at August 3, 2013 and 1,017,502 shares issued and outstanding at July 28, 2012) 10 10
Additional paid-in capital 1,005,833 995,300
Accumulated other comprehensive loss (107,529) (148,792)
Accumulated deficit (67,276) (230,975)
Total stockholders’ equity 831,038 615,543
Total liabilities and stockholders’ equity $5,300,241 $5,201,855
See Notes to Consolidated Financial Statements.
F-5