Neiman Marcus 2012 Annual Report Download - page 61
Download and view the complete annual report
Please find page 61 of the 2012 Neiman Marcus annual report below. You can navigate through the pages in the report by either clicking on the pages listed below, or by using the keyword search tool below to find specific information within the annual report.-
 1
1 -
2
-
3
-
4
-
5
-
6
-
7
-
8
-
9
-
10
-
11
-
12
-
13
-
14
-
15
-
16
-
17
-
18
-
19
-
20
-
21
-
22
-
23
-
24
-
25
-
26
-
27
-
28
-
29
-
30
-
31
-
32
-
33
-
34
-
35
-
36
-
37
-
38
-
39
-
40
-
41
-
42
-
43
-
44
-
45
-
46
-
47
-
48
-
49
-
50
-
 51
51 -
 52
52 -
 53
53 -
 54
54 -
 55
55 -
 56
56 -
 57
57 -
 58
58 -
 59
59 -
 60
60 -
 61
61 -
 62
62 -
 63
63 -
 64
64 -
 65
65 -
 66
66 -
 67
67 -
 68
68 -
 69
69 -
 70
70 -
 71
71 -
72
-
73
-
74
-
75
-
76
-
77
-
78
-
79
-
80
-
81
-
82
-
83
-
84
-
85
-
86
-
87
-
88
-
89
-
90
-
91
-
92
-
93
-
94
-
95
-
96
-
97
-
98
-
99
-
100
-
101
-
102
-
103
-
104
-
105
-
106
-
107
-
108
-
109
-
110
-
111
-
112
-
113
-
114
-
115
-
116
-
117
-
118
-
119
-
120
-
121
-
122
-
123
-
124
-
125
-
126
-
127
-
128
-
129
-
130
-
131
-
132
-
133
-
134
-
135
-
136
-
137
-
138
-
139
-
140
-
141
-
142
-
143
-
144
-
145
-
146
-
147
-
148
-
149
-
150
-
151
-
152
-
153
-
154
-
155
-
156
-
157
-
158
-
159
-
160
-
161
-
162
-
163
-
164
-
165
-
166
-
167
-
168
-
169
-
170
-
171
-
172
-
173
-
174
-
175
-
176
-
177
 |
 |

Table of Contents
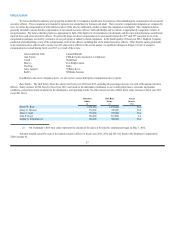
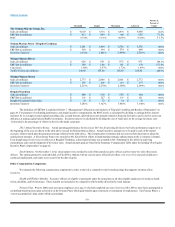
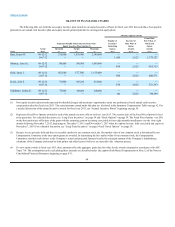
Threshold Target Maximum Achieved
Payout As
Percent of
Target
The Neiman Marcus Group, Inc.
Sales (in millions) $4,618 $4,734 $4,834 $ 4,648 44.4%
EBITDA (in millions) $ 613 $ 649 $700 $635 71.5%
ROIC 35.34%37.33%40.87%36.04%51.5%
Neiman Marcus Stores / Bergdorf Goodman
Sales (in millions) $3,381 $3,464 $3,536 $ 3,376 00.0%
EBITDA (in millions) $ 510 $ 534 $ 574 $ 498 00.0%
Inventory Turnover 2.341%2.401%2.499%2.316%00.0%
Neiman Marcus Direct
Sales (in millions) $928 $951 $975 $971 184.3%
EBITDA (in millions) $ 160 $ 166 $ 181 $ 174 151.4%
Conversion 1.60%1.67%1.72%1.49%00.0%
Traffic/Visitors (in millions) 144.60 153.46 158.30 168.61 200.0%
Neiman Marcus Stores
Sales (in millions) $ 2,773 $ 2,846 $2,901 $2,772 00.0%
EBITDA (in millions) $387 $407 $437 $377 00.0%
Inventory Turnover 2.213%2.270%2.360%2.194%00.0%
Bergdorf Goodman
Sales (in millions) $ 608 $ 618 $635 $604 00.0%
EBITDA (in millions) $123 $ 127 $ 137 $ 121 00.0%
Bergdorf Goodman Online Sales $70 $ 72 $ 74 $70 00.0%
Inventory Turnover 3.245%3.327%3.492%3.146%00.0%
The definition of EBITDA is explained in Item 7, “Management’s Discussion and Analysis of Financial Condition and Results of Operations” on
page 24. For purposes of evaluating performance and annual incentive compensation, the ROIC metric is calculated by dividing 1) earnings before interest
and taxes by 2) average invested capital excluding cash, accrued interest, deferred taxes and amounts related to financial derivatives and is used to assess our
efficiency at turning capital into profitable investments. Inventory turnover is calculated by dividing the cost of retail sales by the average inventory cost.
Conversion is the percentage of visitors to the site who make a purchase.
2013 Annual Incentive Bonus. Actual operating performance for fiscal year 2013 for all operating divisions was below performance targets set at
the beginning of the year (as shown in the table above) except for Neiman Marcus Direct. Annual incentive amounts are to be paid to each of the named
executive officers based upon the payout percentage reflected in the table above. The Compensation Committee did not exercise their discretion to adjust the
actual payout amounts. A discretionary bonus was awarded to Mr. Koryl for his efforts in implementing strategic enhancements to the e-commerce channel.
Even though target levels were not achieved at Bergdorf Goodman, a discretionary bonus was awarded to Mr. Schulman for his efforts in achieving
extraordinary sales and development of his senior team. Actual amounts paid are listed in the Summary Compensation Table under the heading “Non-Equity
Incentive Plan Compensation” on page 62.
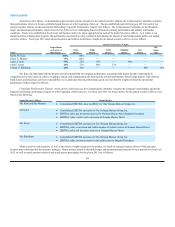
Stock Options. On November 7, 2012, stock options were awarded to each of the named executive officers and to twenty-two (22) other senior
officers. The options granted to each individual are Fixed Price Options with an exercise price of $2,025 per share, vest over a five-year period subject to
continued employment, and expire seven years from the date of grant.
Other Compensation Components
We maintain the following compensation components in order to provide a competitive total rewards package that supports retention of key
executives.
Health and Welfare Benefits. Executive officers are eligible to participate under the same plans as all other eligible employees for medical, dental,
vision, disability, and life insurance. These benefits are intended to be competitive with benefits offered in the retail industry.
Pension Plan. Prior to 2008, most non-union employees over age 21 who had completed one year of service with 1,000 or more hours participated in
our defined benefit pension plan (referred to as the Pension Plan), which paid benefits upon retirement or termination of employment. The Pension Plan is a
“career-accumulation” plan, under which a participant
59