Neiman Marcus 2012 Annual Report Download - page 59
Download and view the complete annual report
Please find page 59 of the 2012 Neiman Marcus annual report below. You can navigate through the pages in the report by either clicking on the pages listed below, or by using the keyword search tool below to find specific information within the annual report.-
 1
1 -
2
-
3
-
4
-
5
-
6
-
7
-
8
-
9
-
10
-
11
-
12
-
13
-
14
-
15
-
16
-
17
-
18
-
19
-
20
-
21
-
22
-
23
-
24
-
25
-
26
-
27
-
28
-
29
-
30
-
31
-
32
-
33
-
34
-
35
-
36
-
37
-
38
-
39
-
40
-
41
-
42
-
43
-
44
-
45
-
46
-
47
-
48
-
 49
49 -
 50
50 -
 51
51 -
 52
52 -
 53
53 -
 54
54 -
 55
55 -
 56
56 -
 57
57 -
 58
58 -
 59
59 -
 60
60 -
 61
61 -
 62
62 -
 63
63 -
 64
64 -
 65
65 -
 66
66 -
 67
67 -
 68
68 -
 69
69 -
70
-
71
-
72
-
73
-
74
-
75
-
76
-
77
-
78
-
79
-
80
-
81
-
82
-
83
-
84
-
85
-
86
-
87
-
88
-
89
-
90
-
91
-
92
-
93
-
94
-
95
-
96
-
97
-
98
-
99
-
100
-
101
-
102
-
103
-
104
-
105
-
106
-
107
-
108
-
109
-
110
-
111
-
112
-
113
-
114
-
115
-
116
-
117
-
118
-
119
-
120
-
121
-
122
-
123
-
124
-
125
-
126
-
127
-
128
-
129
-
130
-
131
-
132
-
133
-
134
-
135
-
136
-
137
-
138
-
139
-
140
-
141
-
142
-
143
-
144
-
145
-
146
-
147
-
148
-
149
-
150
-
151
-
152
-
153
-
154
-
155
-
156
-
157
-
158
-
159
-
160
-
161
-
162
-
163
-
164
-
165
-
166
-
167
-
168
-
169
-
170
-
171
-
172
-
173
-
174
-
175
-
176
-
177
 |
 |

Table of Contents
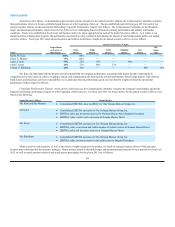
We have identified an industry peer group that includes the 14 companies listed below for purposes of benchmarking the compensation of our named
executive officers. These companies are intended to represent our competitors for business and talent. Their executive compensation programs are compared to
ours, as well as the compensation of individual executives if the jobs are sufficiently similar to make the comparison meaningful. The comparison data is
generally intended to ensure that the compensation of our named executive officers, both individually and as a whole, is appropriately competitive relative to
our performance. We believe that this practice is appropriate in light of the high level of commitment, job demands, and the expected performance contribution
required from each of our executive officers. We generally target our direct compensation to be positioned between the 50 and 75 percentile levels of the
compensation packages received by executives in our peer group of industry related companies. In the fourth quarter of fiscal year 2012, Haigh & Company
conducted a benchmarking review of the compensation of all of our officers, including that of the named executive officers. Other than the equity grant made
to the named executive officers and to twenty-two (22) other senior officers in the second quarter, no significant changes in design or levels of executive
compensation were made during fiscal year 2013 as a result of the review.
Abercrombie & Fitch Limited Brands
Ann Taylor Fifth & Pacific (formerly Liz Claiborne)
Coach Nordstrom
Macy’s Polo Ralph Lauren
The Gap Saks
Jones Apparel Tiffany & Co.
Kohl’s Williams-Sonoma
In addition to the select companies above, we also review various third party compensation survey reports.
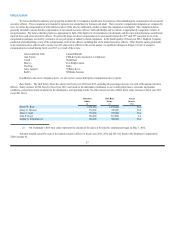
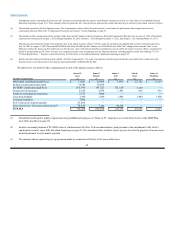
Base Salary. The table below shows the salaries for fiscal years 2012 and 2013, including the percentage increase, for each of the named executive
officers. Salary increase for Mr. Koryl in fiscal year 2013 was based on his individual contribution to our overall performance, economic and market
conditions, general movement of salaries in the marketplace, and operating results. No other named executive officer had a salary increase in fiscal year 2013,
except Mr. Koryl.
2012 Base
Salary
($)
2013 Base
Salary
($)
Percent
Increase
(%)
Karen W. Katz 1,070,000 1,070,000 N/A
James E. Skinner 720,000 720,000 N/A
James J. Gold 770,000 770,000 N/A
John E. Koryl 500,000 512,000 2.4
Joshua G. Schulman (1) 500,000 500,000 N/A
(1) Mr. Schulman’s 2013 base salary represents the amount of his salary at the time his employment began on May 7, 2012.
Amounts actually earned by each of the named executive officers in fiscal years 2011, 2012 and 2013 are listed in the Summary Compensation
Table on page 62.
57
th th