Neiman Marcus 2012 Annual Report Download - page 103
Download and view the complete annual report
Please find page 103 of the 2012 Neiman Marcus annual report below. You can navigate through the pages in the report by either clicking on the pages listed below, or by using the keyword search tool below to find specific information within the annual report.-
 1
1 -
2
-
3
-
4
-
5
-
6
-
7
-
8
-
9
-
10
-
11
-
12
-
13
-
14
-
15
-
16
-
17
-
18
-
19
-
20
-
21
-
22
-
23
-
24
-
25
-
26
-
27
-
28
-
29
-
30
-
31
-
32
-
33
-
34
-
35
-
36
-
37
-
38
-
39
-
40
-
41
-
42
-
43
-
44
-
45
-
46
-
47
-
48
-
49
-
50
-
51
-
52
-
53
-
54
-
55
-
56
-
57
-
58
-
59
-
60
-
61
-
62
-
63
-
64
-
65
-
66
-
67
-
68
-
69
-
70
-
71
-
72
-
73
-
74
-
75
-
76
-
77
-
78
-
79
-
80
-
81
-
82
-
83
-
84
-
85
-
86
-
87
-
88
-
89
-
90
-
91
-
92
-
 93
93 -
 94
94 -
 95
95 -
 96
96 -
 97
97 -
 98
98 -
 99
99 -
 100
100 -
 101
101 -
 102
102 -
 103
103 -
 104
104 -
 105
105 -
 106
106 -
 107
107 -
 108
108 -
 109
109 -
 110
110 -
 111
111 -
 112
112 -
 113
113 -
114
-
115
-
116
-
117
-
118
-
119
-
120
-
121
-
122
-
123
-
124
-
125
-
126
-
127
-
128
-
129
-
130
-
131
-
132
-
133
-
134
-
135
-
136
-
137
-
138
-
139
-
140
-
141
-
142
-
143
-
144
-
145
-
146
-
147
-
148
-
149
-
150
-
151
-
152
-
153
-
154
-
155
-
156
-
157
-
158
-
159
-
160
-
161
-
162
-
163
-
164
-
165
-
166
-
167
-
168
-
169
-
170
-
171
-
172
-
173
-
174
-
175
-
176
-
177
 |
 |
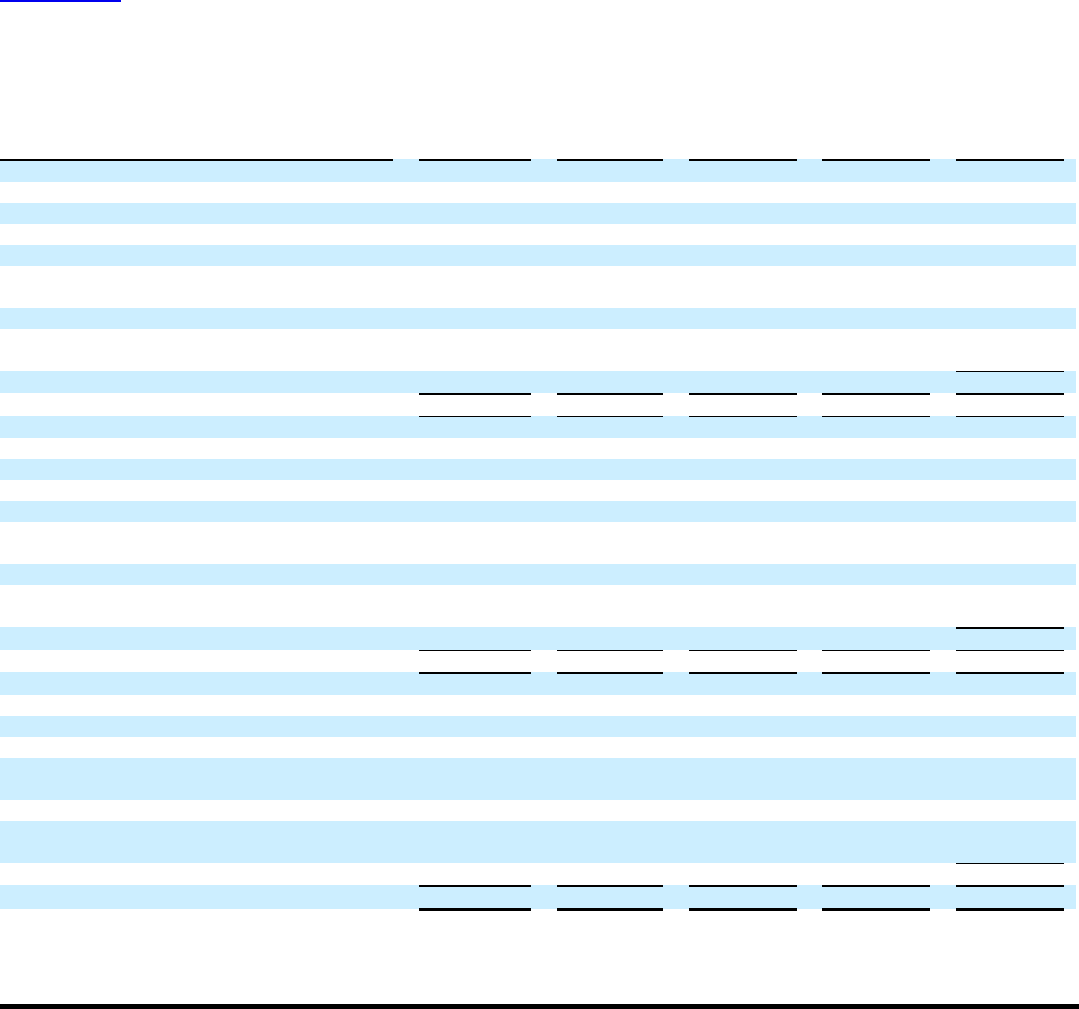
Table of Contents
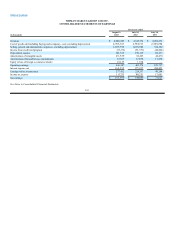
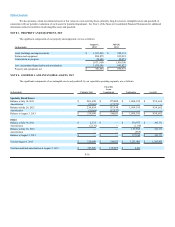
NEIMAN MARCUS GROUP LTD INC.
CONSOLIDATED STATEMENTS OF STOCKHOLDERS’ EQUITY
(in thousands)
Common
stock
Additional
paid-in
capital
Accumulated
other
comprehensive
(loss) earnings
Retained
earnings
(deficit)
Total
stockholders’
equity
BALANCE AT JULY 31, 2010 $10 $1,434,321 $(106,274) $ (402,684) $ 925,373
Stock-based compensation expense —3,943 — — 3,943
Issuance of common stock —129 — — 129
Comprehensive earnings:
Net earnings — — — 31,623 31,623
Adjustments for fluctuations in fair market value of
financial instruments, net of tax of ($541) — — (830) — (830)
Reclassification to earnings, net of tax of $9,289 — — 14,287 — 14,287
Change in unfunded benefit obligations, net of tax of
$12,857 — — 19,772 —19,772
Total comprehensive earnings 64,852
BALANCE AT JULY 30, 2011 10 1,438,393 (73,045)(371,061)994,297
Stock-based compensation expense —6,914 — — 6,914
Stock option exercises and other —(712) — — (712)
Distributions to stockholders —(449,295) — — (449,295)
Comprehensive earnings:
Net earnings — — — 140,086 140,086
Adjustments for fluctuations in fair market value of
financial instruments, net of tax of ($2,457) — — (3,779) — (3,779)
Reclassification to earnings, net of tax of $1,307 — — 2,011 —2,011
Change in unfunded benefit obligations, net of tax of
($48,099) — — (73,979) — (73,979)
Total comprehensive earnings 64,339
BALANCE AT JULY 28, 2012 10 995,300 (148,792) (230,975) 615,543
Stock-based compensation expense —9,710 — — 9,710
Stock option exercises and other —823 — — 823
Comprehensive earnings:
Net earnings — — — 163,699 163,699
Adjustments for fluctuations in fair market value of
financial instruments, net of tax of ($333) — — (513) — (513)
Reclassification to earnings, net of tax of $1,369 — — 2,106 —2,106
Change in unfunded benefit obligations, net of tax of
$25,792 — — 39,670 —39,670
Total comprehensive earnings 204,962
BALANCE AT AUGUST 3, 2013 $10 $1,005,833 $(107,529)$(67,276)$831,038
See Notes to Consolidated Financial Statements.
F-9