Neiman Marcus 2012 Annual Report Download - page 118
Download and view the complete annual report
Please find page 118 of the 2012 Neiman Marcus annual report below. You can navigate through the pages in the report by either clicking on the pages listed below, or by using the keyword search tool below to find specific information within the annual report.-
 1
1 -
2
-
3
-
4
-
5
-
6
-
7
-
8
-
9
-
10
-
11
-
12
-
13
-
14
-
15
-
16
-
17
-
18
-
19
-
20
-
21
-
22
-
23
-
24
-
25
-
26
-
27
-
28
-
29
-
30
-
31
-
32
-
33
-
34
-
35
-
36
-
37
-
38
-
39
-
40
-
41
-
42
-
43
-
44
-
45
-
46
-
47
-
48
-
49
-
50
-
51
-
52
-
53
-
54
-
55
-
56
-
57
-
58
-
59
-
60
-
61
-
62
-
63
-
64
-
65
-
66
-
67
-
68
-
69
-
70
-
71
-
72
-
73
-
74
-
75
-
76
-
77
-
78
-
79
-
80
-
81
-
82
-
83
-
84
-
85
-
86
-
87
-
88
-
89
-
90
-
91
-
92
-
93
-
94
-
95
-
96
-
97
-
98
-
99
-
100
-
101
-
102
-
103
-
104
-
105
-
106
-
107
-
 108
108 -
 109
109 -
 110
110 -
 111
111 -
 112
112 -
 113
113 -
 114
114 -
 115
115 -
 116
116 -
 117
117 -
 118
118 -
 119
119 -
 120
120 -
 121
121 -
 122
122 -
 123
123 -
 124
124 -
 125
125 -
 126
126 -
 127
127 -
 128
128 -
129
-
130
-
131
-
132
-
133
-
134
-
135
-
136
-
137
-
138
-
139
-
140
-
141
-
142
-
143
-
144
-
145
-
146
-
147
-
148
-
149
-
150
-
151
-
152
-
153
-
154
-
155
-
156
-
157
-
158
-
159
-
160
-
161
-
162
-
163
-
164
-
165
-
166
-
167
-
168
-
169
-
170
-
171
-
172
-
173
-
174
-
175
-
176
-
177
 |
 |

Table of Contents
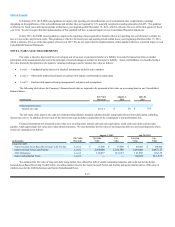
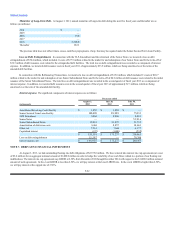
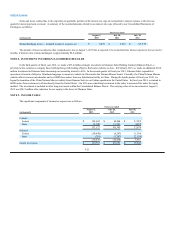
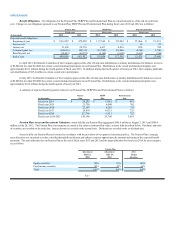
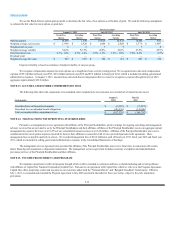
A reconciliation of income tax expense to the amount calculated based on the federal and state statutory rates is as follows:
Fiscal year ended
(in thousands)
August 3,
2013
July 28,
2012
July 30,
2011
Income tax expense at statutory rate $97,101 $79,918 $ 17,242
State income taxes, net of federal income tax benefit 11,672 8,672 874
Unbenefitted losses in foreign subsidiary 4,594 530 —
Tax expense (benefit) related to tax settlements and other changes in tax
liabilities 525 (1,137) 153
Impact of non-taxable income (13)(18)(169)
Impact of non-deductible expenses 683 1,000 77
Other (829) (714) (536)
Total $113,733 $88,251 $17,641
Effective tax rate 41.0%38.7%35.8%
In fiscal year 2013, we generated earnings before income taxes of approximately $277.4 million, which resulted in a recorded income tax expense of
approximately $113.7 million and an effective tax rate of 41.0%. In fiscal year 2012, we generated earnings before income taxes of approximately $228.3
million, which resulted in a recorded income tax expense of approximately $88.3 million and an effective tax rate of 38.7%. The effective tax rates for fiscal
year 2013 and fiscal year 2012 exceeded the statutory rate primarily due to state income taxes and the lack of a U.S. tax benefit related to the losses from our
investment in a foreign e-commerce retailer.
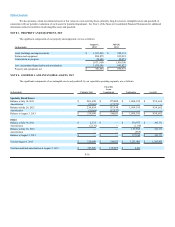
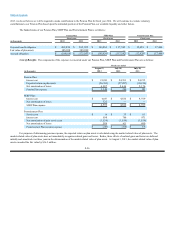
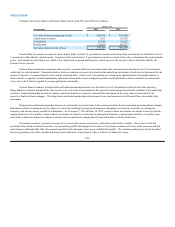
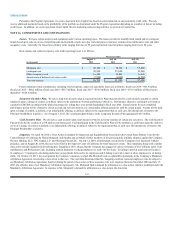
Significant components of our net deferred income tax asset (liability) are as follows:
(in thousands)
August 3,
2013
July 28,
2012
Deferred income tax assets:
Accruals and reserves $25,909 $23,596
Employee benefits 128,225 161,539
Other 20,298 23,260
Total deferred tax assets $174,432 $208,395
Deferred income tax liabilities:
Inventory $(8,110) $ (11,809)
Depreciation and amortization (69,167)(72,732)
Intangible assets (696,056)(714,743)
Other (12,835) (13,232)
Total deferred tax liabilities (786,168)(812,516)
Net deferred income tax liability $(611,736) $ (604,121)
Net deferred income tax asset (liability):
Current $27,645 $22,484
Non-current (639,381) (626,605)
Total $(611,736)$(604,121)
The net deferred tax liability of $611.7 million at August 3, 2013 increased from $604.1 million at July 28, 2012. This increase was comprised
primarily of 1) $33.3 million decrease in deferred tax assets related to the decrease in our employee benefit plan liabilities, partially offset by 2) $18.7 million
decrease in deferred tax liabilities related to the amortization of certain intangible assets and 3) $3.7 million decrease in deferred tax liabilities related to
inventory. We believe it is more likely than not that we will realize the benefits of our recorded deferred tax assets.
F-24