Neiman Marcus 2012 Annual Report Download - page 38
Download and view the complete annual report
Please find page 38 of the 2012 Neiman Marcus annual report below. You can navigate through the pages in the report by either clicking on the pages listed below, or by using the keyword search tool below to find specific information within the annual report.-
 1
1 -
2
-
3
-
4
-
5
-
6
-
7
-
8
-
9
-
10
-
11
-
12
-
13
-
14
-
15
-
16
-
17
-
18
-
19
-
20
-
21
-
22
-
23
-
24
-
25
-
26
-
27
-
 28
28 -
 29
29 -
 30
30 -
 31
31 -
 32
32 -
 33
33 -
 34
34 -
 35
35 -
 36
36 -
 37
37 -
 38
38 -
 39
39 -
 40
40 -
 41
41 -
 42
42 -
 43
43 -
 44
44 -
 45
45 -
 46
46 -
 47
47 -
 48
48 -
49
-
50
-
51
-
52
-
53
-
54
-
55
-
56
-
57
-
58
-
59
-
60
-
61
-
62
-
63
-
64
-
65
-
66
-
67
-
68
-
69
-
70
-
71
-
72
-
73
-
74
-
75
-
76
-
77
-
78
-
79
-
80
-
81
-
82
-
83
-
84
-
85
-
86
-
87
-
88
-
89
-
90
-
91
-
92
-
93
-
94
-
95
-
96
-
97
-
98
-
99
-
100
-
101
-
102
-
103
-
104
-
105
-
106
-
107
-
108
-
109
-
110
-
111
-
112
-
113
-
114
-
115
-
116
-
117
-
118
-
119
-
120
-
121
-
122
-
123
-
124
-
125
-
126
-
127
-
128
-
129
-
130
-
131
-
132
-
133
-
134
-
135
-
136
-
137
-
138
-
139
-
140
-
141
-
142
-
143
-
144
-
145
-
146
-
147
-
148
-
149
-
150
-
151
-
152
-
153
-
154
-
155
-
156
-
157
-
158
-
159
-
160
-
161
-
162
-
163
-
164
-
165
-
166
-
167
-
168
-
169
-
170
-
171
-
172
-
173
-
174
-
175
-
176
-
177
 |
 |

Table of Contents
· do not reflect our considerable interest expense, or the cash requirements necessary to service interest or principal payments, on our debt;
· exclude tax payments that represent a reduction in available cash; and
· do not reflect any cash requirements for assets being depreciated and amortized that may have to be replaced in the future.
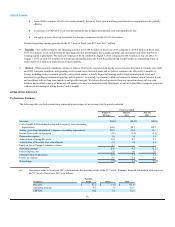
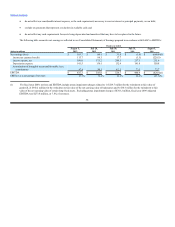
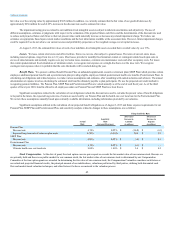
The following table reconciles net earnings as reflected in our Consolidated Statements of Earnings prepared in accordance with GAAP to EBITDA:
Fiscal year ended
August 3, July 28, July 30, July 31, August 1,
(dollars in millions) 2013 2012 2011 2010 2009
Net earnings (loss) $ 163.7 $ 140.1 $ 31.6 $ (1.8) $ (668.0)(1)
Income tax expense (benefit) 113.7 88.3 17.7 (3.5)(220.5)
Interest expense, net 169.0 175.2 280.5 237.1 235.6
Depreciation expense 141.5 130.1 132.4 141.8 150.8
Amortization of intangible assets and favorable lease
commitments 47.4 50.1 62.5 73.3 72.7
EBITDA $ 635.3 $ 583.8 $ 524.7 $ 446.9 $ (429.4)(1)
EBITDA as a percentage of revenues 13.7%13.4%13.1%12.1%(11.8)%
(1) For fiscal year 2009, net loss and EBITDA include pretax impairment charges related to 1) $329.7 million for the writedown to fair value of
goodwill, 2) $343.2 million for the writedown to fair value of the net carrying value of tradenames and 3) $30.3 million for the writedown to fair
value of the net carrying value of certain long-lived assets. Excluding pretax impairment charges of $703.2 million, fiscal year 2009 Adjusted
EBITDA was $273.8 million, or 7.5% of revenues.
36