Neiman Marcus 2012 Annual Report Download - page 102
Download and view the complete annual report
Please find page 102 of the 2012 Neiman Marcus annual report below. You can navigate through the pages in the report by either clicking on the pages listed below, or by using the keyword search tool below to find specific information within the annual report.-
 1
1 -
2
-
3
-
4
-
5
-
6
-
7
-
8
-
9
-
10
-
11
-
12
-
13
-
14
-
15
-
16
-
17
-
18
-
19
-
20
-
21
-
22
-
23
-
24
-
25
-
26
-
27
-
28
-
29
-
30
-
31
-
32
-
33
-
34
-
35
-
36
-
37
-
38
-
39
-
40
-
41
-
42
-
43
-
44
-
45
-
46
-
47
-
48
-
49
-
50
-
51
-
52
-
53
-
54
-
55
-
56
-
57
-
58
-
59
-
60
-
61
-
62
-
63
-
64
-
65
-
66
-
67
-
68
-
69
-
70
-
71
-
72
-
73
-
74
-
75
-
76
-
77
-
78
-
79
-
80
-
81
-
82
-
83
-
84
-
85
-
86
-
87
-
88
-
89
-
90
-
91
-
 92
92 -
 93
93 -
 94
94 -
 95
95 -
 96
96 -
 97
97 -
 98
98 -
 99
99 -
 100
100 -
 101
101 -
 102
102 -
 103
103 -
 104
104 -
 105
105 -
 106
106 -
 107
107 -
 108
108 -
 109
109 -
 110
110 -
 111
111 -
 112
112 -
113
-
114
-
115
-
116
-
117
-
118
-
119
-
120
-
121
-
122
-
123
-
124
-
125
-
126
-
127
-
128
-
129
-
130
-
131
-
132
-
133
-
134
-
135
-
136
-
137
-
138
-
139
-
140
-
141
-
142
-
143
-
144
-
145
-
146
-
147
-
148
-
149
-
150
-
151
-
152
-
153
-
154
-
155
-
156
-
157
-
158
-
159
-
160
-
161
-
162
-
163
-
164
-
165
-
166
-
167
-
168
-
169
-
170
-
171
-
172
-
173
-
174
-
175
-
176
-
177
 |
 |
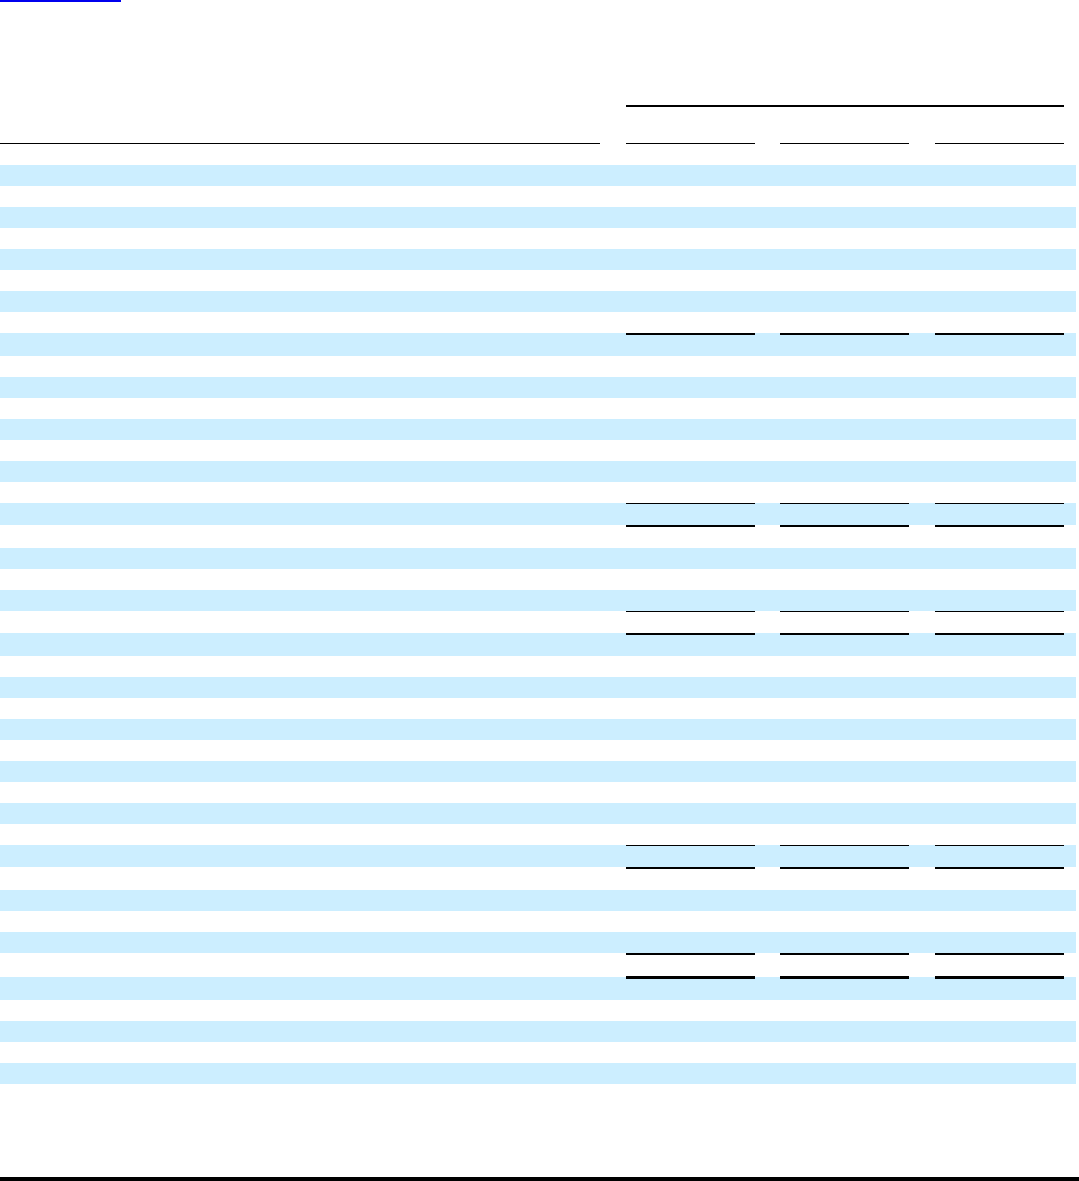
Table of Contents
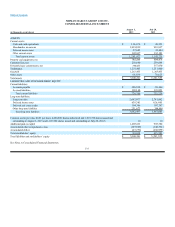
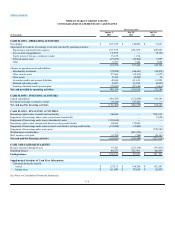
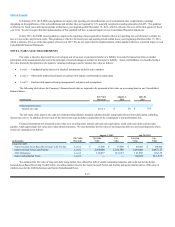
NEIMAN MARCUS GROUP LTD INC.
CONSOLIDATED STATEMENTS OF CASH FLOWS
Fiscal year ended
(in thousands)
August 3,
2013
July 28,
2012
July 30,
2011
CASH FLOWS - OPERATING ACTIVITIES
Net earnings $163,699 $140,086 $ 31,623
Adjustments to reconcile net earnings to net cash provided by operating activities:
Depreciation and amortization expense 197,355 188,699 209,642
Loss on debt extinguishment 15,597 —70,388
Equity in loss of foreign e-commerce retailer 13,125 1,514 —
Deferred income taxes (19,439) (10,094)3,967
Other 5,633 7,004 7,082
375,970 327,209 322,702
Changes in operating assets and liabilities:
Merchandise inventories (79,022) (100,483)(48,818)
Other current assets 27,664 (10,810) (3,527)
Other assets 2,495 (4,495) 79
Accounts payable and accrued liabilities 42,604 62,611 21,520
Deferred real estate credits 4,697 15,059 10,428
Funding of defined benefit pension plan (25,049) (29,281)(30,000)
Net cash provided by operating activities 349,359 259,810 272,384
CASH FLOWS - INVESTING ACTIVITIES
Capital expenditures (146,505) (152,838) (94,181)
Investment in foreign e-commerce retailer (10,000) (29,421) —
Net cash used for investing activities (156,505)(182,259) (94,181)
CASH FLOWS - FINANCING ACTIVITIES
Borrowings under senior secured term loan facility 500,000 —554,265
Repayment of borrowings under senior secured term loan facility — — (7,648)
Repayment of borrowings under senior subordinated notes (510,668) — —
Borrowings under senior secured asset-based revolving credit facility 100,000 175,000 —
Repayment of borrowings under senior secured asset-based revolving credit facility (185,000)(75,000) —
Repayment of borrowings under senior notes — — (790,289)
Distributions to stockholders —(449,295) —
Debt issuance costs paid (9,763) (594) (33,947)
Net cash used for financing activities (105,431) (349,889) (277,619)
CASH AND CASH EQUIVALENTS
Increase (decrease) during the year 87,423 (272,338)(99,416)
Beginning balance 49,253 321,591 421,007
Ending balance $136,676 $49,253 $321,591
Supplemental Schedule of Cash Flow Information:
Cash paid during the year for:
Interest $ 153,131 $ 164,700 $195,543
Income taxes $111,085 $78,854 $22,458
See Notes to Consolidated Financial Statements.
F-8