Neiman Marcus 2012 Annual Report Download - page 28
Download and view the complete annual report
Please find page 28 of the 2012 Neiman Marcus annual report below. You can navigate through the pages in the report by either clicking on the pages listed below, or by using the keyword search tool below to find specific information within the annual report.-
 1
1 -
2
-
3
-
4
-
5
-
6
-
7
-
8
-
9
-
10
-
11
-
12
-
13
-
14
-
15
-
16
-
17
-
 18
18 -
 19
19 -
 20
20 -
 21
21 -
 22
22 -
 23
23 -
 24
24 -
 25
25 -
 26
26 -
 27
27 -
 28
28 -
 29
29 -
 30
30 -
 31
31 -
 32
32 -
 33
33 -
 34
34 -
 35
35 -
 36
36 -
 37
37 -
 38
38 -
39
-
40
-
41
-
42
-
43
-
44
-
45
-
46
-
47
-
48
-
49
-
50
-
51
-
52
-
53
-
54
-
55
-
56
-
57
-
58
-
59
-
60
-
61
-
62
-
63
-
64
-
65
-
66
-
67
-
68
-
69
-
70
-
71
-
72
-
73
-
74
-
75
-
76
-
77
-
78
-
79
-
80
-
81
-
82
-
83
-
84
-
85
-
86
-
87
-
88
-
89
-
90
-
91
-
92
-
93
-
94
-
95
-
96
-
97
-
98
-
99
-
100
-
101
-
102
-
103
-
104
-
105
-
106
-
107
-
108
-
109
-
110
-
111
-
112
-
113
-
114
-
115
-
116
-
117
-
118
-
119
-
120
-
121
-
122
-
123
-
124
-
125
-
126
-
127
-
128
-
129
-
130
-
131
-
132
-
133
-
134
-
135
-
136
-
137
-
138
-
139
-
140
-
141
-
142
-
143
-
144
-
145
-
146
-
147
-
148
-
149
-
150
-
151
-
152
-
153
-
154
-
155
-
156
-
157
-
158
-
159
-
160
-
161
-
162
-
163
-
164
-
165
-
166
-
167
-
168
-
169
-
170
-
171
-
172
-
173
-
174
-
175
-
176
-
177
 |
 |
Table of Contents
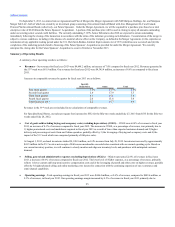
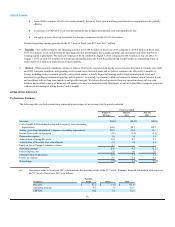
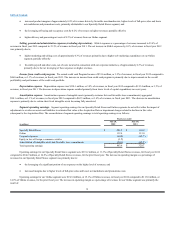
· lower SG&A expenses of 0.6% of revenues primarily driven by lower current and long-term incentive compensation costs; partially
offset by
· an increase in COGS of 0.1% of revenues primarily due to higher promotional costs and markdowns; and
· our equity in losses from our investment in a foreign e-commerce retailer of 0.3% of revenues.
Estimated operating earnings generated in the 53 week of fiscal year 2013 were $10.7 million.
· Liquidity - Net cash provided by our operating activities was $349.4 million in fiscal year 2013 compared to $259.8 million in fiscal year
2012. The increase in net cash provided by operating activities was primarily due to higher earnings and operational cash flows and lower
working capital requirements. We held cash balances of $136.7 million at August 3, 2013 compared to $49.3 million at July 28, 2012. At
August 3, 2013, we had $15.0 million of borrowings outstanding under the Asset-Based Revolving Credit Facility, no outstanding letters of
credit and $615.0 million of unused borrowing availability.
· Outlook - While economic conditions continue to improve from levels experienced during the severe economic downturn in calendar years 2008
and 2009, consumer confidence and spending levels remain below historical peaks and we believe continue to be affected by a number of
factors, including modest economic growth, a rising stock market, a slowly improving housing market, high unemployment levels and
uncertainty regarding governmental spending and tax policies. As a result, we continue to plan our business to balance current business trends
and conditions with our long-term initiatives and growth strategies. We believe the cash generated from our operations along with our cash
balances and available sources of financing will enable us to meet our anticipated cash obligations, as well as to fund the investments associated
with our growth strategies, during the next twelve months.
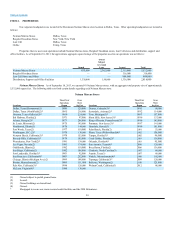
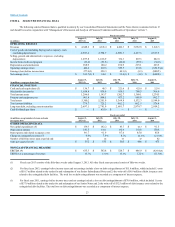
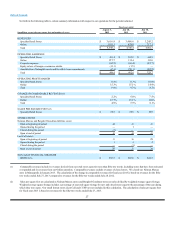
OPERATING RESULTS
Performance Summary
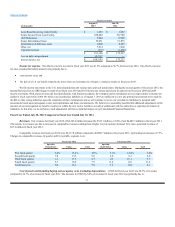
The following table sets forth certain items expressed as percentages of net revenues for the periods indicated.
Fiscal year ended
August 3,
2013 (a)
July 28,
2012
July 30,
2011
Revenues 100.0%100.0%100.0%
Cost of goods sold including buying and occupancy costs (excluding
depreciation) 64.4 64.3 64.7
Selling, general and administrative expenses (excluding depreciation) 22.8 23.4 23.3
Income from credit card program (1.1)(1.2)(1.1)
Depreciation expense 3.0 3.0 3.3
Amortization of intangible assets 0.6 0.7 1.1
Amortization of favorable lease commitments 0.4 0.4 0.4
Equity in loss of foreign e-commerce retailer 0.3 — —
Operating earnings 9.6 9.3 8.2
Interest expense, net 3.6 4.0 7.0
Earnings before income taxes 6.0 5.3 1.2
Income tax expense 2.4 2.0 0.4
Net earnings 3.5%3.2%0.8%
(a) Percentages relate to fiscal year 2013 which includes the operating results of the 53 week. Summary financial information with respect to
the 53 week of fiscal year 2013 is as follows:
(in millions)
Specialty
Retail Online Total
Revenues $ 47.5 $ 14.4 $61.9
Operating earnings 8.2 3.2 10.7
EBITDA 10.2 3.6 13.6
26
rd
rd
rd