Neiman Marcus 2012 Annual Report Download - page 139
Download and view the complete annual report
Please find page 139 of the 2012 Neiman Marcus annual report below. You can navigate through the pages in the report by either clicking on the pages listed below, or by using the keyword search tool below to find specific information within the annual report.-
 1
1 -
2
-
3
-
4
-
5
-
6
-
7
-
8
-
9
-
10
-
11
-
12
-
13
-
14
-
15
-
16
-
17
-
18
-
19
-
20
-
21
-
22
-
23
-
24
-
25
-
26
-
27
-
28
-
29
-
30
-
31
-
32
-
33
-
34
-
35
-
36
-
37
-
38
-
39
-
40
-
41
-
42
-
43
-
44
-
45
-
46
-
47
-
48
-
49
-
50
-
51
-
52
-
53
-
54
-
55
-
56
-
57
-
58
-
59
-
60
-
61
-
62
-
63
-
64
-
65
-
66
-
67
-
68
-
69
-
70
-
71
-
72
-
73
-
74
-
75
-
76
-
77
-
78
-
79
-
80
-
81
-
82
-
83
-
84
-
85
-
86
-
87
-
88
-
89
-
90
-
91
-
92
-
93
-
94
-
95
-
96
-
97
-
98
-
99
-
100
-
101
-
102
-
103
-
104
-
105
-
106
-
107
-
108
-
109
-
110
-
111
-
112
-
113
-
114
-
115
-
116
-
117
-
118
-
119
-
120
-
121
-
122
-
123
-
124
-
125
-
126
-
127
-
128
-
 129
129 -
 130
130 -
 131
131 -
 132
132 -
 133
133 -
 134
134 -
 135
135 -
 136
136 -
 137
137 -
 138
138 -
 139
139 -
 140
140 -
 141
141 -
 142
142 -
 143
143 -
 144
144 -
 145
145 -
 146
146 -
 147
147 -
 148
148 -
 149
149 -
150
-
151
-
152
-
153
-
154
-
155
-
156
-
157
-
158
-
159
-
160
-
161
-
162
-
163
-
164
-
165
-
166
-
167
-
168
-
169
-
170
-
171
-
172
-
173
-
174
-
175
-
176
-
177
 |
 |

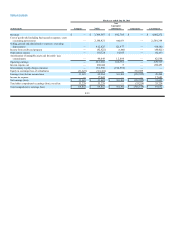
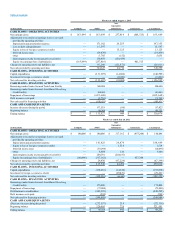
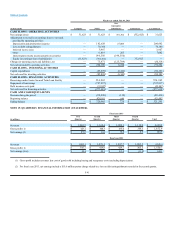
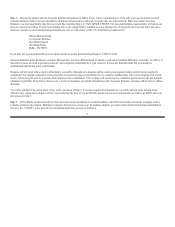
Table of Contents
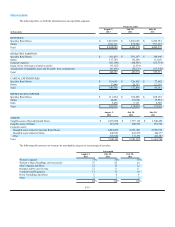
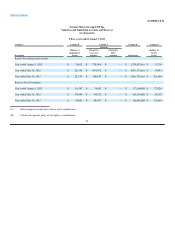
SCHEDULE II
Neiman Marcus Group LTD Inc.
Valuation and Qualifying Accounts and Reserves
(in thousands)
Three years ended August 3, 2013
Column A Column B Column C Column D Column E
Additions
Description
Balance at
Beginning of
Period
Charged to
Costs and
Expenses
Charged to
Other
Accounts Deductions
Balance at
End of
Period
Reserve for estimated sales returns
Year ended August 3, 2013 $34,015 $739,968 $ — $ (736,613)(A) $37,370
Year ended July 28, 2012 $28,558 $694,632 $ — $ (689,175)(A) $34,015
Year ended July 30, 2011 $25,167 $ 590,143 $ — $ (586,752)(A) $28,558
Reserves for self-insurance
Year ended August 3, 2013 $36,187 $74,643 $ — $ (73,204)(B) $37,626
Year ended July 28, 2012 $34,969 $64,532 $ — $ (63,314)(B) $36,187
Year ended July 30, 2011 $36,041 $60,971 $ — $ (62,043)(B) $34,969
(A) Gross margin on actual sales returns, net of commissions.
(B) Claims and expenses paid, net of employee contributions.
93