Neiman Marcus 2012 Annual Report Download - page 34
Download and view the complete annual report
Please find page 34 of the 2012 Neiman Marcus annual report below. You can navigate through the pages in the report by either clicking on the pages listed below, or by using the keyword search tool below to find specific information within the annual report.-
 1
1 -
2
-
3
-
4
-
5
-
6
-
7
-
8
-
9
-
10
-
11
-
12
-
13
-
14
-
15
-
16
-
17
-
18
-
19
-
20
-
21
-
22
-
23
-
 24
24 -
 25
25 -
 26
26 -
 27
27 -
 28
28 -
 29
29 -
 30
30 -
 31
31 -
 32
32 -
 33
33 -
 34
34 -
 35
35 -
 36
36 -
 37
37 -
 38
38 -
 39
39 -
 40
40 -
 41
41 -
 42
42 -
 43
43 -
 44
44 -
45
-
46
-
47
-
48
-
49
-
50
-
51
-
52
-
53
-
54
-
55
-
56
-
57
-
58
-
59
-
60
-
61
-
62
-
63
-
64
-
65
-
66
-
67
-
68
-
69
-
70
-
71
-
72
-
73
-
74
-
75
-
76
-
77
-
78
-
79
-
80
-
81
-
82
-
83
-
84
-
85
-
86
-
87
-
88
-
89
-
90
-
91
-
92
-
93
-
94
-
95
-
96
-
97
-
98
-
99
-
100
-
101
-
102
-
103
-
104
-
105
-
106
-
107
-
108
-
109
-
110
-
111
-
112
-
113
-
114
-
115
-
116
-
117
-
118
-
119
-
120
-
121
-
122
-
123
-
124
-
125
-
126
-
127
-
128
-
129
-
130
-
131
-
132
-
133
-
134
-
135
-
136
-
137
-
138
-
139
-
140
-
141
-
142
-
143
-
144
-
145
-
146
-
147
-
148
-
149
-
150
-
151
-
152
-
153
-
154
-
155
-
156
-
157
-
158
-
159
-
160
-
161
-
162
-
163
-
164
-
165
-
166
-
167
-
168
-
169
-
170
-
171
-
172
-
173
-
174
-
175
-
176
-
177
 |
 |

Table of Contents
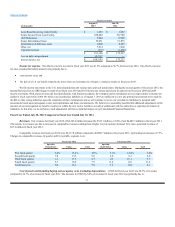
Equity in loss of foreign e-commerce retailer. In the third quarter of fiscal year 2012, we made a strategic investment in a foreign e-commerce
retailer. This investment is accounted for under the equity method and our equity in the investee’s loss was $13.1 million, or 0.3% of revenues, in fiscal year
2013.
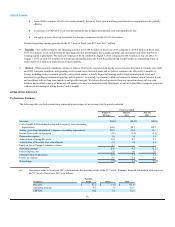
Operating earnings. Total operating earnings in fiscal year 2013 were $446.4 million, or 9.6% of revenues, compared to $403.6 million, or 9.3%
of revenues, in fiscal year 2012. Our operating earnings margin increased by 0.3% of revenues in fiscal year 2013 primarily due to:
· lower SG&A expenses of 0.6% of revenues primarily driven by lower current and long-term incentive compensation costs; partially offset by
· an increase in COGS of 0.1% of revenues primarily due to higher promotional costs and markdowns; and
· our equity in losses from our investment in a foreign e-commerce retailer of 0.3% of revenues.
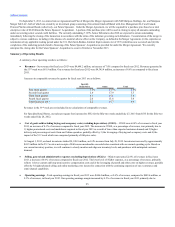
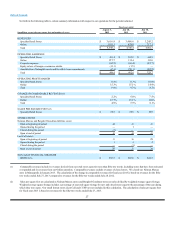
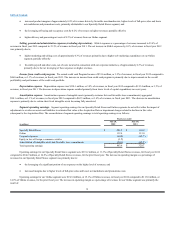
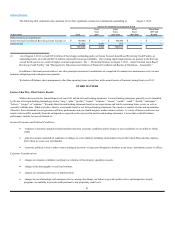
Segment operating earnings. Segment operating earnings for our Specialty Retail Stores and Online segments do not reflect either the impact of
adjustments to revalue our assets and liabilities to estimated fair value at the Acquisition Date or impairment charges related to declines in fair value
subsequent to the Acquisition. The reconciliation of segment operating earnings to total operating earnings is as follows:
Fiscal year ended
August 3, July 28,
(in millions) 2013 2012
Specialty Retail Stores $411.4 $ 391.2
Online 157.7 132.4
Corporate expenses (62.2) (68.4)
Equity in loss of foreign e-commerce retailer (13.1) (1.5)
Amortization of intangible assets and favorable lease commitments (47.4)(50.1)
Total operating earnings $446.4 $403.6
Operating earnings for our Specialty Retail Stores segment were $411.4 million, or 11.4% of Specialty Retail Stores revenues, in fiscal year 2013
compared to $391.2 million, or 11.3% of Specialty Retail Stores revenues, for the prior fiscal year. The increase in operating margin as a percentage of
revenues for our Specialty Retail Stores segment was primarily due to:
· lower SG&A expenses primarily due to lower current incentive compensation costs; partially offset by
· decreased product margins as a result of higher promotional costs and markdowns.
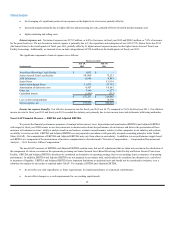
Operating earnings for our Online segment were $157.7 million, or 15.3% of Online revenues, in fiscal year 2013 compared to $132.4 million, or
15.1% of Online revenues, for the prior fiscal year. The increase in operating margin as a percentage of revenues for our Online segment was primarily the
result of:
· leveraging of buying and occupancy costs and SG&A expenses, net of investments in marketing expenses to support our growth strategies, on
the higher level of revenues; partially offset by
· lower product margins as a result of higher promotional costs and markdowns;
· higher delivery and processing net costs as a result of lower revenues collected from our customers; and
· higher depreciation expense.
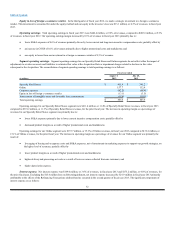
Interest expense. Net interest expense was $169.0 million, or 3.6% of revenues, in fiscal year 2013 and $175.2 million, or 4.0% of revenues, for
the prior fiscal year. Excluding the $15.6 million loss on debt extinguishment, net interest expense decreased by $21.9 million in fiscal year 2013 primarily
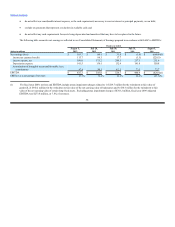
attributable to the effects of the Refinancing Transactions (defined herein) executed in the second quarter of fiscal year 2013. The significant components of
interest expense are as follows:
32