Neiman Marcus 2012 Annual Report Download - page 105
Download and view the complete annual report
Please find page 105 of the 2012 Neiman Marcus annual report below. You can navigate through the pages in the report by either clicking on the pages listed below, or by using the keyword search tool below to find specific information within the annual report.-
 1
1 -
2
-
3
-
4
-
5
-
6
-
7
-
8
-
9
-
10
-
11
-
12
-
13
-
14
-
15
-
16
-
17
-
18
-
19
-
20
-
21
-
22
-
23
-
24
-
25
-
26
-
27
-
28
-
29
-
30
-
31
-
32
-
33
-
34
-
35
-
36
-
37
-
38
-
39
-
40
-
41
-
42
-
43
-
44
-
45
-
46
-
47
-
48
-
49
-
50
-
51
-
52
-
53
-
54
-
55
-
56
-
57
-
58
-
59
-
60
-
61
-
62
-
63
-
64
-
65
-
66
-
67
-
68
-
69
-
70
-
71
-
72
-
73
-
74
-
75
-
76
-
77
-
78
-
79
-
80
-
81
-
82
-
83
-
84
-
85
-
86
-
87
-
88
-
89
-
90
-
91
-
92
-
93
-
94
-
 95
95 -
 96
96 -
 97
97 -
 98
98 -
 99
99 -
 100
100 -
 101
101 -
 102
102 -
 103
103 -
 104
104 -
 105
105 -
 106
106 -
 107
107 -
 108
108 -
 109
109 -
 110
110 -
 111
111 -
 112
112 -
 113
113 -
 114
114 -
 115
115 -
116
-
117
-
118
-
119
-
120
-
121
-
122
-
123
-
124
-
125
-
126
-
127
-
128
-
129
-
130
-
131
-
132
-
133
-
134
-
135
-
136
-
137
-
138
-
139
-
140
-
141
-
142
-
143
-
144
-
145
-
146
-
147
-
148
-
149
-
150
-
151
-
152
-
153
-
154
-
155
-
156
-
157
-
158
-
159
-
160
-
161
-
162
-
163
-
164
-
165
-
166
-
167
-
168
-
169
-
170
-
171
-
172
-
173
-
174
-
175
-
176
-
177
 |
 |

Table of Contents
has declined and appropriately marking the retail value of the merchandise down to the perceived value and 3) estimating the shrinkage that has occurred
between physical inventory counts. These judgments and estimates, coupled with the averaging processes within the retail method can, under certain
circumstances, produce varying financial results. Factors that can lead to different financial results include 1) determination of original retail values for
merchandise held for sale, 2) identification of declines in perceived value of inventories and processing the appropriate retail value markdowns and 3) overly
optimistic or conservative estimation of shrinkage. In prior years, we have not made material changes to our estimates of shrinkage or markdown requirements
on inventories held as of the end of our fiscal years.
Consistent with industry business practice, we receive allowances from certain of our vendors in support of the merchandise we purchase for resale.
Certain allowances are received to reimburse us for markdowns taken or to support the gross margins that we earn in connection with the sales of the vendor’s
merchandise. These allowances result in an increase to gross margin when we earn the allowances and they are approved by the vendor. Other allowances we
receive represent reductions to the amounts we pay to acquire the merchandise. These allowances reduce the cost of the acquired merchandise and are
recognized at the time the goods are sold. The amounts of vendor allowances we receive fluctuate based on the level of markdowns taken and did not have a
significant impact on the year-over-year change in gross margin during fiscal years 2013, 2012 or 2011. We received vendor allowances of $90.2 million, or
1.9% of revenues, in fiscal year 2013, $92.5 million, or 2.1% of revenues, in fiscal year 2012 and $87.5 million, or 2.2% of revenues, in fiscal year 2011.
We obtain certain merchandise, primarily precious jewelry, on a consignment basis in order to expand our product assortment. Consignment
merchandise held by us with a cost basis of $358.9 million at August 3, 2013 and $328.6 million at July 28, 2012 is not reflected in our Consolidated
Balance Sheets.
Cost of goods sold also includes delivery charges we pay to third party carriers and other costs related to the fulfillment of customer orders not
delivered at the point-of-sale.
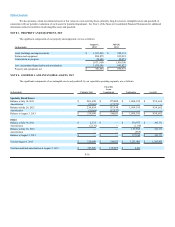
Long-lived Assets. Property and equipment are stated at cost less accumulated depreciation. For financial reporting purposes, we compute
depreciation principally using the straight-line method over the estimated useful lives of the assets. Buildings and improvements are depreciated over five to
30 years while fixtures and equipment are depreciated over three to 15 years. Leasehold improvements are amortized over the shorter of the asset life or the lease
term (which may include renewal periods when exercise of the renewal option is at our discretion and exercise of the renewal option is considered reasonably
assured). Costs incurred for the development of internal computer software are capitalized and amortized using the straight-line method over three to ten years.
We assess the recoverability of the carrying values of our store assets, consisting of property and equipment, customer lists and favorable lease
commitments, annually and upon the occurrence of certain events. The recoverability assessment requires judgment and estimates of future store generated
cash flows.
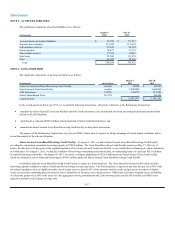
Intangible Assets Subject to Amortization. Customer lists and amortizable tradenames are amortized using the straight-line method over their
estimated useful lives, ranging from four to 24 years (weighted average life of 13 years from the Acquisition). Favorable lease commitments are amortized
straight-line over the remaining lives of the leases, ranging from nine to 49 years (weighted average life of 33 years from the Acquisition). Total estimated
amortization of all Acquisition-related intangible assets for the next five fiscal years is currently estimated as follows (in thousands):
2014 $46,881
2015 46,615
2016 45,867
2017 44,576
2018 42,789
Indefinite-lived Intangible Assets and Goodwill. Indefinite-lived intangible assets, such as tradenames and goodwill, are not subject to
amortization. Rather, we assess the recoverability of indefinite-lived intangible assets and goodwill in the fourth quarter of each fiscal year and upon the
occurrence of certain events.
The recoverability assessment with respect to each of our indefinite-lived intangible assets requires us to estimate the fair value of the asset as of the
assessment date. Such determination is made using discounted cash flow techniques (Level 3 determination of fair value). Significant inputs to the valuation
model include:
· future revenue, cash flow and/or profitability projections;
F-11