Neiman Marcus 2012 Annual Report Download - page 123
Download and view the complete annual report
Please find page 123 of the 2012 Neiman Marcus annual report below. You can navigate through the pages in the report by either clicking on the pages listed below, or by using the keyword search tool below to find specific information within the annual report.-
 1
1 -
2
-
3
-
4
-
5
-
6
-
7
-
8
-
9
-
10
-
11
-
12
-
13
-
14
-
15
-
16
-
17
-
18
-
19
-
20
-
21
-
22
-
23
-
24
-
25
-
26
-
27
-
28
-
29
-
30
-
31
-
32
-
33
-
34
-
35
-
36
-
37
-
38
-
39
-
40
-
41
-
42
-
43
-
44
-
45
-
46
-
47
-
48
-
49
-
50
-
51
-
52
-
53
-
54
-
55
-
56
-
57
-
58
-
59
-
60
-
61
-
62
-
63
-
64
-
65
-
66
-
67
-
68
-
69
-
70
-
71
-
72
-
73
-
74
-
75
-
76
-
77
-
78
-
79
-
80
-
81
-
82
-
83
-
84
-
85
-
86
-
87
-
88
-
89
-
90
-
91
-
92
-
93
-
94
-
95
-
96
-
97
-
98
-
99
-
100
-
101
-
102
-
103
-
104
-
105
-
106
-
107
-
108
-
109
-
110
-
111
-
112
-
 113
113 -
 114
114 -
 115
115 -
 116
116 -
 117
117 -
 118
118 -
 119
119 -
 120
120 -
 121
121 -
 122
122 -
 123
123 -
 124
124 -
 125
125 -
 126
126 -
 127
127 -
 128
128 -
 129
129 -
 130
130 -
 131
131 -
 132
132 -
 133
133 -
134
-
135
-
136
-
137
-
138
-
139
-
140
-
141
-
142
-
143
-
144
-
145
-
146
-
147
-
148
-
149
-
150
-
151
-
152
-
153
-
154
-
155
-
156
-
157
-
158
-
159
-
160
-
161
-
162
-
163
-
164
-
165
-
166
-
167
-
168
-
169
-
170
-
171
-
172
-
173
-
174
-
175
-
176
-
177
 |
 |

Table of Contents
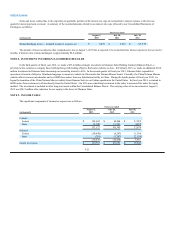
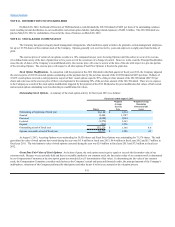
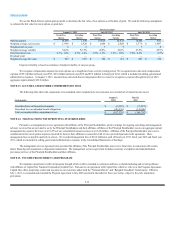
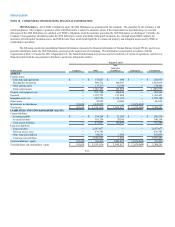
The following tables set forth by level, within the fair value hierarchy, the Pension Plan’s assets at fair value as of August 3, 2013 and July 28,
2012.
August 3, 2013
(in thousands) Level 1 Level 2 Level 3 Total
Equity securities:
Common/collective trusts $ — $ 12,279 $ — $ 12,279
Hedge funds — — 176,951 176,951
Limited partnership interests — — 4,197 4,197
Fixed income securities:
Corporate debt securities —34,204 —34,204
Mutual funds 93,033 — — 93,033
U.S. government securities 12,630 — — 12,630
Common/collective trusts — 47,178 — 47,178
Other —5,366 —5,366
Total investments $105,663 $99,027 $ 181,148 $ 385,838
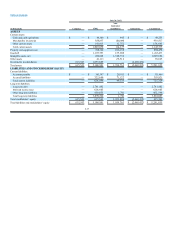
July 28, 2012
(in thousands) Level 1 Level 2 Level 3 Total
Equity securities:
Corporate stock $ 7,036 $ — $ — $ 7,036
Mutual funds 10,387 — — 10,387
Common/collective trusts —57,630 —57,630
Hedge funds — — 109,026 109,026
Limited partnership interests — — 23,048 23,048
Fixed income securities:
Corporate debt securities —44,149 —44,149
Mutual funds 126,585 — — 126,585
U.S. government securities 6,952 — — 6,952
Other —5,086 —5,086
Total investments $150,960 $106,865 $132,074 $389,899
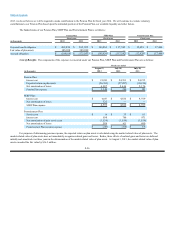
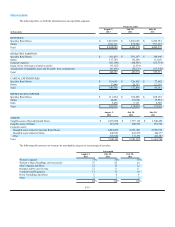
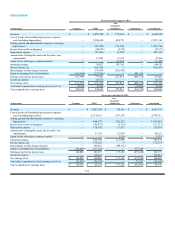
The table below sets forth a summary of changes in the fair value of our Pension Plan’s Level 3 investment assets for the fiscal years 2013 and 2012.
Fiscal years
(in thousands) 2013 2012
Balance, beginning of year $132,074 $163,219
Purchases 133,462 32,697
Sales (96,672)(63,431)
Realized gains 15,257 5,998
Unrealized losses relating to investments sold (17,041)(9,278)
Unrealized gains relating to investments still held 14,068 2,869
Balance, end of year $ 181,148 $ 132,074
F-29