Neiman Marcus 2012 Annual Report Download - page 45
Download and view the complete annual report
Please find page 45 of the 2012 Neiman Marcus annual report below. You can navigate through the pages in the report by either clicking on the pages listed below, or by using the keyword search tool below to find specific information within the annual report.-
 1
1 -
2
-
3
-
4
-
5
-
6
-
7
-
8
-
9
-
10
-
11
-
12
-
13
-
14
-
15
-
16
-
17
-
18
-
19
-
20
-
21
-
22
-
23
-
24
-
25
-
26
-
27
-
28
-
29
-
30
-
31
-
32
-
33
-
34
-
 35
35 -
 36
36 -
 37
37 -
 38
38 -
 39
39 -
 40
40 -
 41
41 -
 42
42 -
 43
43 -
 44
44 -
 45
45 -
 46
46 -
 47
47 -
 48
48 -
 49
49 -
 50
50 -
 51
51 -
 52
52 -
 53
53 -
 54
54 -
 55
55 -
56
-
57
-
58
-
59
-
60
-
61
-
62
-
63
-
64
-
65
-
66
-
67
-
68
-
69
-
70
-
71
-
72
-
73
-
74
-
75
-
76
-
77
-
78
-
79
-
80
-
81
-
82
-
83
-
84
-
85
-
86
-
87
-
88
-
89
-
90
-
91
-
92
-
93
-
94
-
95
-
96
-
97
-
98
-
99
-
100
-
101
-
102
-
103
-
104
-
105
-
106
-
107
-
108
-
109
-
110
-
111
-
112
-
113
-
114
-
115
-
116
-
117
-
118
-
119
-
120
-
121
-
122
-
123
-
124
-
125
-
126
-
127
-
128
-
129
-
130
-
131
-
132
-
133
-
134
-
135
-
136
-
137
-
138
-
139
-
140
-
141
-
142
-
143
-
144
-
145
-
146
-
147
-
148
-
149
-
150
-
151
-
152
-
153
-
154
-
155
-
156
-
157
-
158
-
159
-
160
-
161
-
162
-
163
-
164
-
165
-
166
-
167
-
168
-
169
-
170
-
171
-
172
-
173
-
174
-
175
-
176
-
177
 |
 |

Table of Contents
· our ability to provide credit to our customers pursuant to our proprietary credit card program arrangement, including any future changes in the
terms of such arrangement and/or legislation impacting the extension of credit to our customers;
· the design and implementation of new information systems as well as enhancements of existing systems; and
· other risks, uncertainties and factors set forth in this Annual Report on Form 10-K, including those set forth in Item 1A, “Risk Factors.”
The foregoing factors are not exhaustive, and new factors may emerge or changes to the foregoing factors may occur that could impact our business.
Except to the extent required by law, we undertake no obligation to update or revise (publicly or otherwise) any forward-looking statements to reflect subsequent
events, new information or future circumstances.
Critical Accounting Policies
Our accounting policies are more fully described in Note 1 of the Notes to Consolidated Financial Statements in Item 15 of this Annual Report. As
disclosed in Note 1 of the Notes to Consolidated Financial Statements, the preparation of financial statements in conformity with generally accepted accounting
principles requires us to make estimates and assumptions about future events. These estimates and assumptions affect the amounts of assets, liabilities,
revenues and expenses and the disclosure of gain and loss contingencies at the date of our audited Consolidated Financial Statements appearing elsewhere in
this Annual Report on Form 10-K. Our current estimates are subject to change if different assumptions as to the outcome of future events were made. We
evaluate our estimates and judgments on an ongoing basis and predicate those estimates and judgments on historical experience and on various other factors
that we believe to be reasonable under the circumstances. We make adjustments to our assumptions and judgments when facts and circumstances dictate.
Since future events and their effects cannot be determined with absolute certainty, actual results may differ from the estimates used in preparing the
accompanying audited Consolidated Financial Statements.
We believe the following critical accounting policies encompass the more significant judgments and estimates used in the preparation of our audited
Consolidated Financial Statements.
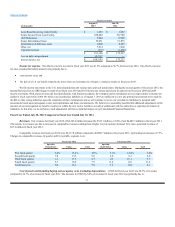
Revenues. Revenues include sales of merchandise and services and delivery and processing revenues related to merchandise sold. Revenues are
recognized at the later of the point of sale or the delivery of goods to the customer. Revenues associated with gift cards are recognized at the time of redemption
by the customer. Revenues exclude sales taxes collected from our customers.
Revenues are reduced when customers return goods previously purchased. We maintain reserves for anticipated sales returns primarily based on our
historical trends related to returns by our customers. Our reserves for anticipated sales returns aggregated $37.4 million at August 3, 2013 and $34.0 million at
July 28, 2012. As the vast majority of merchandise returns are made in less than 30 days after the sales transaction, we believe the risk that differences
between our estimated and actual returns is minimal and will not have a material impact on our Consolidated Financial Statements.
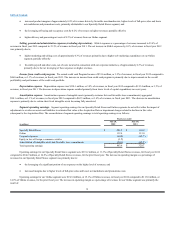
Merchandise Inventories and Cost of Goods Sold. We utilize the retail inventory method of accounting. Under the retail inventory method, the
valuation of inventories at cost and the resulting gross margins are determined by applying a calculated cost-to-retail ratio, for various groupings of similar
items, to the retail value of our inventories. The cost of the inventory reflected on the Consolidated Balance Sheets is decreased by charges to cost of goods sold
at average cost and the retail value of the inventory is lowered through the use of markdowns. Earnings are negatively impacted when merchandise is marked
down. As we adjust the retail value of our inventories through the use of markdowns to reflect market conditions, our merchandise inventories are stated at the
lower of cost or market.
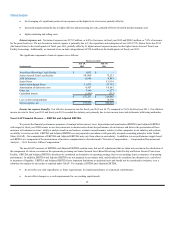
The areas requiring significant management judgment related to the valuation of our inventories include 1) setting the original retail value for the
merchandise held for sale, 2) recognizing merchandise for which the customer’s perception of value has declined and appropriately marking the retail value of
the merchandise down to the perceived value and 3) estimating the shrinkage that has occurred between physical inventory counts. These judgments and
estimates, coupled with the averaging processes within the retail method can, under certain circumstances, produce varying financial results. Factors that can
lead to different financial results include 1) determination of original retail values for merchandise held for sale, 2) identification of declines in perceived value
of inventories and processing the appropriate retail value markdowns and 3) overly optimistic or conservative estimation of shrinkage. In prior years, we have
not made material changes to our estimates of shrinkage or markdown requirements on inventories held as of the end of our fiscal years. We do not believe that
changes in the assumptions and estimates, if any, used in the valuation of our inventories at August 3, 2013 will have a material effect on our future operating
performance.
43