Neiman Marcus 2012 Annual Report Download - page 133
Download and view the complete annual report
Please find page 133 of the 2012 Neiman Marcus annual report below. You can navigate through the pages in the report by either clicking on the pages listed below, or by using the keyword search tool below to find specific information within the annual report.-
 1
1 -
2
-
3
-
4
-
5
-
6
-
7
-
8
-
9
-
10
-
11
-
12
-
13
-
14
-
15
-
16
-
17
-
18
-
19
-
20
-
21
-
22
-
23
-
24
-
25
-
26
-
27
-
28
-
29
-
30
-
31
-
32
-
33
-
34
-
35
-
36
-
37
-
38
-
39
-
40
-
41
-
42
-
43
-
44
-
45
-
46
-
47
-
48
-
49
-
50
-
51
-
52
-
53
-
54
-
55
-
56
-
57
-
58
-
59
-
60
-
61
-
62
-
63
-
64
-
65
-
66
-
67
-
68
-
69
-
70
-
71
-
72
-
73
-
74
-
75
-
76
-
77
-
78
-
79
-
80
-
81
-
82
-
83
-
84
-
85
-
86
-
87
-
88
-
89
-
90
-
91
-
92
-
93
-
94
-
95
-
96
-
97
-
98
-
99
-
100
-
101
-
102
-
103
-
104
-
105
-
106
-
107
-
108
-
109
-
110
-
111
-
112
-
113
-
114
-
115
-
116
-
117
-
118
-
119
-
120
-
121
-
122
-
 123
123 -
 124
124 -
 125
125 -
 126
126 -
 127
127 -
 128
128 -
 129
129 -
 130
130 -
 131
131 -
 132
132 -
 133
133 -
 134
134 -
 135
135 -
 136
136 -
 137
137 -
 138
138 -
 139
139 -
 140
140 -
 141
141 -
 142
142 -
 143
143 -
144
-
145
-
146
-
147
-
148
-
149
-
150
-
151
-
152
-
153
-
154
-
155
-
156
-
157
-
158
-
159
-
160
-
161
-
162
-
163
-
164
-
165
-
166
-
167
-
168
-
169
-
170
-
171
-
172
-
173
-
174
-
175
-
176
-
177
 |
 |
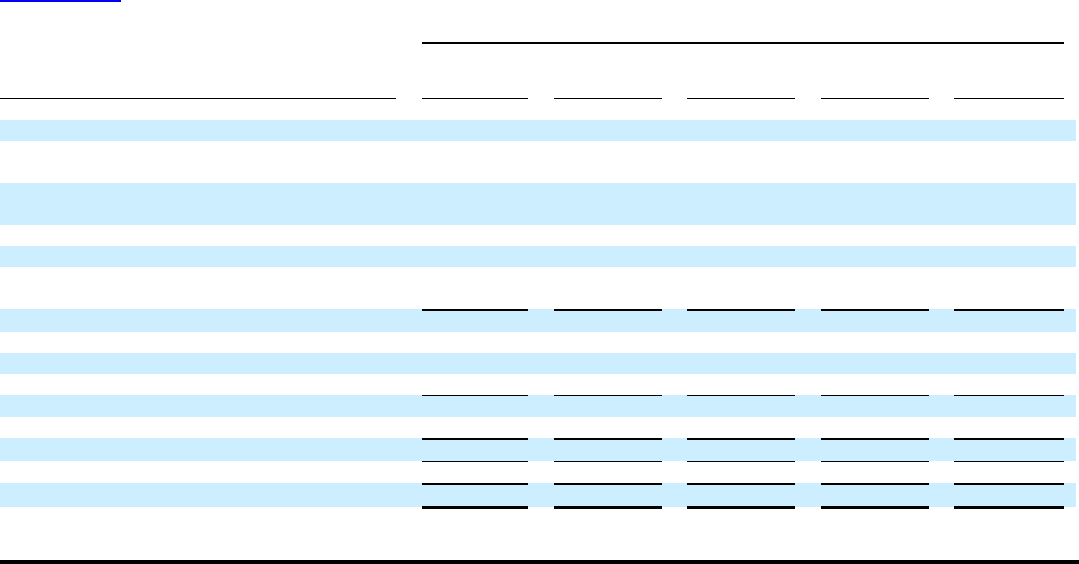
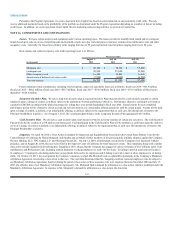
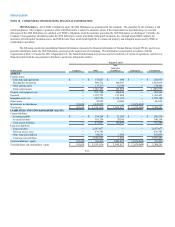
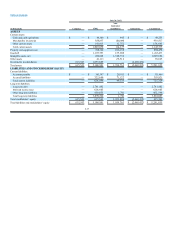
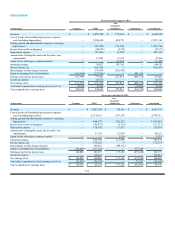
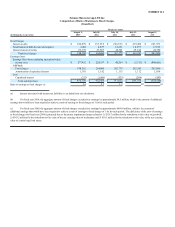
Table of Contents
Fiscal year ended July 30, 2011
(in thousands) Company NMG
Non-
Guarantor
Subsidiaries Eliminations Consolidated
Revenues $ — $ 3,309,567 $692,705 $ — $ 4,002,272
Cost of goods sold including buying and occupancy costs
(excluding depreciation) — 2,148,421 440,873 —2,589,294
Selling, general and administrative expenses (excluding
depreciation) —812,825 121,477 — 934,302
Income from credit card program — (42,622) (3,400) — (46,022)
Depreciation expense —118,328 14,105 — 132,433
Amortization of intangible assets and favorable lease
commitments —49,649 12,899 —62,548
Operating earnings —222,966 106,751 —329,717
Interest expense, net —280,448 5 — 280,453
Intercompany royalty charges (income) —194,556 (194,556) — —
Equity in (earnings) loss of subsidiaries (31,623)(301,302) — 332,925 —
Earnings (loss) before income taxes 31,623 49,264 301,302 (332,925) 49,264
Income tax expense —17,641 — — 17,641
Net earnings (loss) $ 31,623 $ 31,623 $ 301,302 $ (332,925) $ 31,623
Total other comprehensive earnings (loss), net of tax 33,229 33,229 — (33,229) 33,229
Total comprehensive earnings (loss) $64,852 $64,852 $301,302 $(366,154)$64,852
F-39