Mazda 2016 Annual Report Download - page 68
Download and view the complete annual report
Please find page 68 of the 2016 Mazda annual report below. You can navigate through the pages in the report by either clicking on the pages listed below, or by using the keyword search tool below to find specific information within the annual report.-
 1
1 -
2
-
3
-
4
-
5
-
6
-
7
-
8
-
9
-
10
-
11
-
12
-
13
-
14
-
15
-
16
-
17
-
18
-
19
-
20
-
21
-
22
-
23
-
24
-
25
-
26
-
27
-
28
-
29
-
30
-
31
-
32
-
33
-
34
-
35
-
36
-
37
-
38
-
39
-
40
-
41
-
42
-
43
-
44
-
45
-
46
-
47
-
48
-
49
-
50
-
51
-
52
-
53
-
54
-
55
-
56
-
57
-
 58
58 -
 59
59 -
 60
60 -
 61
61 -
 62
62 -
 63
63 -
 64
64 -
 65
65 -
 66
66 -
 67
67 -
 68
68 -
 69
69 -
 70
70 -
 71
71 -
 72
72 -
 73
73 -
 74
74 -
 75
75 -
 76
76
 |
 |

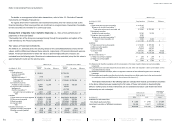
Millions of yen
Reportable segments
Adjustment (*1) Consolidated (*2)
For the year ended March 31, 2015 Japan
North
America Europe Other areas Total
Net sales:
Outside customers ¥ 942,414 ¥1,019,269 ¥606,647 ¥465,569 ¥3,033,899 ¥ — ¥3,033,899
Inter-segment 1,585,731 236,877 16,257 17,811 1,856,676 (1,856,676) —
Total 2,528,145 1,256,146 622,904 483,380 4,890,575 (1,856,676) 3,033,899
Segment income 142,382 37,881 14,925 13,491 208,679 (5,791) 202,888
Segment assets 1,973,969 442,361 209,672 271,156 2,897,158 (423,871) 2,473,287
Other items:
Depreciation and amortization 52,081 11,693 3,863 1,220 68,857 — 68,857
Amortization of goodwill 15 — — — 15 — 15
Investments in affiliated companies on the equity method 20,828 — 2,440 92,676 115,944 — 115,944
Increase in property, plant and equipment and intangible assets 75,706 34,296 2,194 18,814 131,010 — 131,010
(*1) Notes on adjustment:
(1) The adjustment on segment income is eliminations of inter-segment transactions.
(2) The adjustment on segment assets is mainly eliminations of inter-segment receivables and payables.
(*2) Segment income is reconciled with the operating income in the consolidated statements of income for the years ended March 31, 2016 and 2015.
Segment assets are reconciled with the total assets in the consolidated balance sheets for the years ended March 31, 2016 and 2015.
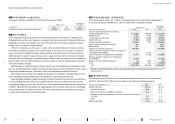
Associated information
Information by geographic areas
The sales information by geographic areas for the years ended March 31, 2016 and 2015 were as
follows:
Millions of yen
Thousands of
U.S. dollars
For the years ended March 31 2016 2015 2016
Japan ¥ 660,935 ¥ 617,397 $ 5,848,982
North America 1,158,428 1,022,247 10,251,575
Europe 688,984 613,367 6,097,204
Other areas 898,256 780,888 7,949,168
Total ¥3,406,603 ¥3,033,899 $30,146,929
Sales is categorized into the countries or regions based on the customers’ locations.
18 RELATED PARTY TRANSACTIONS
There were no transactions with related parties to be disclosed during the years ended
March 31, 2016 and 2015.
Notes to Consolidated Financial Statements
MAZDA ANNUAL REPORT 2016
Financial Section
Message from
Management
Review of Operations
Drivers of Value Creation
Foundations Underpinning
Sustainable Growth
Contents