Mazda 2016 Annual Report Download - page 67
Download and view the complete annual report
Please find page 67 of the 2016 Mazda annual report below. You can navigate through the pages in the report by either clicking on the pages listed below, or by using the keyword search tool below to find specific information within the annual report.-
 1
1 -
2
-
3
-
4
-
5
-
6
-
7
-
8
-
9
-
10
-
11
-
12
-
13
-
14
-
15
-
16
-
17
-
18
-
19
-
20
-
21
-
22
-
23
-
24
-
25
-
26
-
27
-
28
-
29
-
30
-
31
-
32
-
33
-
34
-
35
-
36
-
37
-
38
-
39
-
40
-
41
-
42
-
43
-
44
-
45
-
46
-
47
-
48
-
49
-
50
-
51
-
52
-
53
-
54
-
55
-
56
-
 57
57 -
 58
58 -
 59
59 -
 60
60 -
 61
61 -
 62
62 -
 63
63 -
 64
64 -
 65
65 -
 66
66 -
 67
67 -
 68
68 -
 69
69 -
 70
70 -
 71
71 -
 72
72 -
 73
73 -
 74
74 -
 75
75 -
 76
76
 |
 |

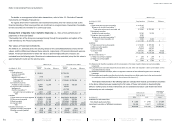
Net sales, income or loss, and assets by reportable segments
Net sales, income or loss, and assets by reportable segments for the years ended March 31, 2016 and 2015 were as follows:
Millions of yen
Reportable segments
Adjustment (*1) Consolidated (*2)
For the year ended March 31, 2016 Japan
North
America Europe Other areas Total
Net sales:
Outside customers ¥1,016,260 ¥1,157,524 ¥674,998 ¥557,821 ¥3,406,603 ¥ — ¥3,406,603
Inter-segment 1,799,423 282,883 14,978 37,176 2,134,460 (2,134,460) —
Total 2,815,683 1,440,407 689,976 594,997 5,541,063 (2,134,460) 3,406,603
Segment income 162,528 29,818 8,724 21,589 222,659 4,116 226,775
Segment assets 2,044,532 412,383 214,586 262,182 2,933,683 (385,282) 2,548,401
Other items:
Depreciation and amortization 54,862 16,997 4,068 3,045 78,972 — 78,972
Amortization of goodwill ———————
Investments in affiliated companies on the equity method 21,535 — — 96,631 118,166 — 118,166
Increase in property, plant and equipment and intangible assets 66,343 14,181 2,639 6,051 89,214 — 89,214
Thousands of U.S. dollars
Reportable segments
Adjustment (*1) Consolidated (*2)
For the year ended March 31, 2016 Japan
North
America Europe Other areas Total
Net sales:
Outside customers $ 8,993,451 $10,243,575 $5,973,434 $4,936,469 $30,146,929 $ — $30,146,929
Inter-segment 15,924,097 2,503,389 132,549 328,991 18,889,026 (18,889,026) —
Total 24,917,548 12,746,964 6,105,983 5,265,460 49,035,955 (18,889,026) 30,146,929
Segment income 1,438,301 263,876 77,204 191,053 1,970,434 36,424 2,006,858
Segment assets 18,093,204 3,649,407 1,898,991 2,320,195 25,961,797 (3,409,576) 22,552,221
Other items:
Depreciation and amortization 485,504 150,416 36,000 26,947 698,867 — 698,867
Amortization of goodwill ———————
Investments in affiliated companies on the equity method 190,575 — — 855,142 1,045,717 — 1,045,717
Increase in property, plant and equipment and intangible assets 587,106 125,496 23,354 53,548 789,504 — 789,504
Notes to Consolidated Financial Statements
MAZDA ANNUAL REPORT 2016
Financial Section
Message from
Management
Review of Operations
Drivers of Value Creation
Foundations Underpinning
Sustainable Growth
Contents