Mazda 2016 Annual Report Download - page 50
Download and view the complete annual report
Please find page 50 of the 2016 Mazda annual report below. You can navigate through the pages in the report by either clicking on the pages listed below, or by using the keyword search tool below to find specific information within the annual report.-
 1
1 -
2
-
3
-
4
-
5
-
6
-
7
-
8
-
9
-
10
-
11
-
12
-
13
-
14
-
15
-
16
-
17
-
18
-
19
-
20
-
21
-
22
-
23
-
24
-
25
-
26
-
27
-
28
-
29
-
30
-
31
-
32
-
33
-
34
-
35
-
36
-
37
-
38
-
39
-
 40
40 -
 41
41 -
 42
42 -
 43
43 -
 44
44 -
 45
45 -
 46
46 -
 47
47 -
 48
48 -
 49
49 -
 50
50 -
 51
51 -
 52
52 -
 53
53 -
 54
54 -
 55
55 -
 56
56 -
 57
57 -
 58
58 -
 59
59 -
 60
60 -
61
-
62
-
63
-
64
-
65
-
66
-
67
-
68
-
69
-
70
-
71
-
72
-
73
-
74
-
75
-
76
 |
 |

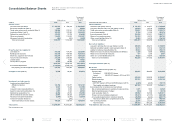
Millions of yen
Thousands of
U.S. dollars
(Note 1)
ASSETS 2016 2015 2016
Current assets:
Cash and cash equivalents ¥ 568,714 ¥ 529,148 $ 5,032,867
Short-term investments (Note 4) 3,000 — 26,549
Trade notes and accounts receivable (Note 4) 198,894 215,161 1,760,124
Inventories (Notes 6 and 9) 383,515 379,502 3,393,938
Deferred tax assets (Note 14) 105,653 76,758 934,982
Other current assets 134,612 114,622 1,191,257
Allowance for doubtful receivables (681) (763) (6,027)
Total current assets 1,393,707 1,314,428 12,333,690
Property, plant and equipment:
Land (Note 7) 410,195 414,347 3,630,044
Buildings and structures 495,156 485,498 4,381,912
Machinery, equipment and vehicles 882,218 866,077 7,807,239
Tools, furniture and fixtures 216,308 206,656 1,914,230
Leased assets 8,455 7,623 74,823
Construction in progress 35,180 52,939 311,327
2,047,512 2,033,140 18,119,575
Accumulated depreciation (1,109,992) (1,090,116) (9,822,938)
Net property, plant and equipment (Notes 8 and 9) 937,520 943,024 8,296,637
Intangible assets (Note 8) 30,738 29,361 272,018
Investments and other assets:
Investment securities (Note 4):
Affiliated companies 121,152 118,977 1,072,141
Other 14,911 15,248 131,956
Long-term loans receivable (Note 4) 4,309 6,036 38,133
Asset for retirement benefits (Note 10) 2,887 3,323 25,549
Deferred tax assets (Note 14) 22,256 25,784 196,956
Other investments and other assets 23,870 20,325 211,238
Allowance for doubtful receivables (2,949) (2,970) (26,097)
Investment valuation allowance — (249) —
Total investments and other assets 186,436 186,474 1,649,876
Total assets ¥ 2,548,401 ¥ 2,473,287 $22,552,221
See accompanying notes.
Millions of yen
Thousands of
U.S. dollars
(Note 1)
LIABILITIES AND NET ASSETS 2016 2015 2016
Current liabilities:
Short-term debt (Notes 4 and 9) ¥ 117,143 ¥ 116,677 $ 1,036,664
Long-term debt due within one year (Notes 4 and 9) 143,044 96,132 1,265,876
Trade notes and accounts payable (Note 4) 374,637 379,358 3,315,372
Income taxes payable 31,784 16,398 281,274
Accrued expenses (Note 4) 204,159 215,011 1,806,717
Reserve for warranty expenses 104,723 45,763 926,752
Other current liabilities (Note 14) 30,980 34,720 274,159
Total current liabilities 1,006,470 904,059 8,906,814
Non-current liabilities:
Long-term debt due after one year (Notes 4 and 9) 356,945 488,210 3,158,805
Deferred tax liability related to land revaluation (Note 7) 64,719 68,134 572,735
Liability for retirement benefits (Note 10) 85,916 62,669 760,319
Reserve for loss on business of subsidiaries and affiliates 7,326 8,955 64,832
Reserve for environmental measures 677 1,090 5,991
Other non-current liabilities (Note 14) 49,625 48,844 439,159
Total non-current liabilities 565,208 677,902 5,001,841
Contingent liabilities (Note 11)
Net Assets:
Capital and retained earnings (Note 12):
Common stock 258,957 258,957 2,291,655
Authorized: 1,200,000,000 shares
Issued: 599,875,479 shares in 2016 and 2015
Capital surplus 243,048 242,650 2,150,867
Retained earnings 367,601 248,094 3,253,106
T reasury stock
(2,057,937 shares in 2016 and 2,055,369 shares in 2015) (2,228) (2,222) (19,717)
Total capital and retained earnings 867,378 747,479 7,675,911
Accumulated other comprehensive income/(loss):
Net unrealized gain/(loss) on available-for-sale securities 3,721 3,681 32,929
Deferred gains/(losses) on hedges (600) 668 (5,310)
Land revaluation (Note 7) 145,952 142,586 1,291,611
Foreign currency translation adjustment (36,877) (21,376) (326,345)
Accumulated adjustments for retirement benefits (25,558) (3,443) (226,177)
Total accumulated other comprehensive income 86,638 122,116 766,708
Non-controlling interests 22,707 21,731 200,947
Total net assets 976,723 891,326 8,643,566
Total liabilities and net assets ¥ 2,548,401 ¥ 2,473,287 $22,552,221
Consolidated Balance Sheets Mazda Motor Corporation and Consolidated Subsidiaries
March 31, 2016 and 2015
MAZDA ANNUAL REPORT 2016
48 Financial Section
Message from
Management
Review of Operations
Drivers of Value Creation
Foundations Underpinning
Sustainable Growth
Contents