Mazda 2016 Annual Report Download - page 45
Download and view the complete annual report
Please find page 45 of the 2016 Mazda annual report below. You can navigate through the pages in the report by either clicking on the pages listed below, or by using the keyword search tool below to find specific information within the annual report.-
 1
1 -
2
-
3
-
4
-
5
-
6
-
7
-
8
-
9
-
10
-
11
-
12
-
13
-
14
-
15
-
16
-
17
-
18
-
19
-
20
-
21
-
22
-
23
-
24
-
25
-
26
-
27
-
28
-
29
-
30
-
31
-
32
-
33
-
34
-
 35
35 -
 36
36 -
 37
37 -
 38
38 -
 39
39 -
 40
40 -
 41
41 -
 42
42 -
 43
43 -
 44
44 -
 45
45 -
 46
46 -
 47
47 -
 48
48 -
 49
49 -
 50
50 -
 51
51 -
 52
52 -
 53
53 -
 54
54 -
 55
55 -
56
-
57
-
58
-
59
-
60
-
61
-
62
-
63
-
64
-
65
-
66
-
67
-
68
-
69
-
70
-
71
-
72
-
73
-
74
-
75
-
76
 |
 |

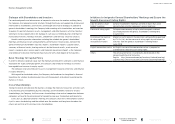
Analysis of Business Results, Financial Position, and Cash Flows
production declined ¥14.6 billion, or 18.5%, to ¥64.4 billion, while sales of parts grew ¥12.5
billion, or 5.4%, to ¥244.2 billion, and other sales rose ¥13.7 billion, or 6.2%, to ¥236.5 billion.
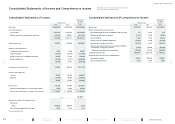
Operating Income
Operating income rose ¥23.9 billion, or 11.8%, from the previous year, to ¥226.8 billion.
Despite an adverse effect from exchange rate movements and an increase in expenses
related to future growth, including stepped-up investment for development and a rise in fi xed
costs for a new plant in Mexico, higher unit sales and an improved model mix from SKYACTIV-
equipped models, and continued cost reductions through Monotsukuri Innovation, resulted in
an overall increase.
Ordinary Income and Net Income Attributable to Owners of the Parent
Ordinary income included a ¥22.0 billion gain from equity in net income of affi liated companies
as well as a ¥16.0 billion foreign exchange loss, for an overall increase of ¥11.0 billion, or
5.2%, to ¥223.6 billion. Net income attributable to owners of the parent declined ¥24.4 billion,
or 15.4%, to ¥134.4 billion, due to factors including a one-time extraordinary loss from a
reserve for product warranties and ¥29.7 billion of total income taxes.
Segment Information
Net sales in Japan grew ¥287.5 billion, or 11.4%, to ¥2,815.7 billion, with a ¥20.1 billion, or
14.1%, increase in operating income, to ¥162.5 billion. These increases were mainly from a
rise in unit sales and an improved model mix, combined with progress in cost reductions.
In North America, net sales rose ¥184.3 billion, or 14.7%, to ¥1,440.4 billion, while
operating income declined ¥8.1 billion, or 21.3%, to ¥29.8 billion. Although unit sales moved
up and the model mix improved, profi t declined due to an increase in depreciation expenses
associated with the new plant in Mexico.
European net sales rose ¥67.1 billion, or 10.8%, to ¥690.0 billion, while operating income
declined ¥6.2 billion, or 41.5%, to ¥8.7 billion. These results mainly refl ected increased unit
sales and an improved model mix in major countries, partially offset by the yen’s appreciation
against the euro and the effect of the contraction of demand in Russia.
In other markets, net sales rose ¥111.6 billion, or 23.1%, to ¥595.0 billion, and operating
income increased ¥8.1 billion, or 60.0%, to ¥21.6 billion, primarily from higher unit sales and
an improved model mix.
Financial Position
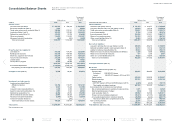
Total assets as of March 31, 2016, were ¥2,548.4 billion, a gain of ¥75.1 billion from the end of
the previous fi scal year, resulting from increases in items including cash and time deposits and
deferred tax assets.
Total liabilities were ¥1,571.7 billion, a decrease of ¥10.3 billion from the previous fi scal
year-end, mainly from a reduction in long-term loans payable. Interest-bearing debt was
reduced by ¥83.9 billion, to ¥617.1 billion, and net interest-bearing debt (interest-bearing debt
minus cash and cash equivalents) as of the fi scal year-end totaled ¥48.4 billion, a ¥123.5
billion decrease from the end of the previous fi scal year. The net debt-to-equity ratio improved
14.7 percentage points, to 5.1%.
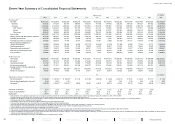
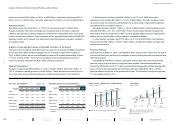
Net sales by Segment*1 (Billions of yen)
(Years ended
March 31) 2012 2013 2014 2015 2016
Japan 1,745.0 1,893.6 2,263.3 2,528.1 2,815.7
North America 571.6 650.0 843.6 1,256.1 1,440.4
Europe 360.4 354.8 540.5 622.9 690.0
Other markets 294.2 418.7 414.2 483.4 595.0
Adjustment (938.1) (1,111.8) (1,369.4) (1,856.7) (2,134.5)
Consolidated 2,033.1 2,205.3 2,692.2 3,033.9 3,406.6
Operating Income (Loss) by Segment*2
(Billions of yen)
(Years ended
March 31) 2012 2013 2014 2015 2016
Japan (18.4) 108.4 173.5 142.4 162.5
North America (40.3) (48.9) 1.3 37.9 29.8
Europe 5.6 3.1 8.5 14.9 8.7
Other markets 10.1 16.8 5.8 13.5 21.6
Adjustment 4.3 (25.5) (7.0) (5.8) 4.1
Consolidated (38.7) 53.9 182.1 202.9 226.8
Years ended March 31
108.9
154.7
(95.5)
204.5
(108.1)
262.8
2012 2013 2014 2015 2016
(79.4)
8.7
(9.1)
(70.3)
49.0
(40.3)
16.3
(120.1)
136.4
891.3
2,473.3
2012 2013 2014 2015 2016
35.2
976.7
2,548.4
37.4
1,915.9 1,978.6
513.2
474.4 676.8
2,246.0
29.4
25.1
24.5
■ Total Assets ■ Net Assets Equity Ratio ■ Cash Flows from Operating Activities
■ Cash Flows from Investing Activities
Free Cash Flow
*1 Net sales by geographic area based on reportable segments *2 Operating income by geographic area based on reportable
segments
Total Assets / Net Assets / Equity Ratio
(Billions of yen / %)
Cash Flows
(Billions of yen)
MAZDA ANNUAL REPORT 2016
43 Financial Section
Message from
Management
Review of Operations
Drivers of Value Creation
Foundations Underpinning
Sustainable Growth
Contents