Mazda 2016 Annual Report Download - page 44
Download and view the complete annual report
Please find page 44 of the 2016 Mazda annual report below. You can navigate through the pages in the report by either clicking on the pages listed below, or by using the keyword search tool below to find specific information within the annual report.-
 1
1 -
2
-
3
-
4
-
5
-
6
-
7
-
8
-
9
-
10
-
11
-
12
-
13
-
14
-
15
-
16
-
17
-
18
-
19
-
20
-
21
-
22
-
23
-
24
-
25
-
26
-
27
-
28
-
29
-
30
-
31
-
32
-
33
-
 34
34 -
 35
35 -
 36
36 -
 37
37 -
 38
38 -
 39
39 -
 40
40 -
 41
41 -
 42
42 -
 43
43 -
 44
44 -
 45
45 -
 46
46 -
 47
47 -
 48
48 -
 49
49 -
 50
50 -
 51
51 -
 52
52 -
 53
53 -
 54
54 -
55
-
56
-
57
-
58
-
59
-
60
-
61
-
62
-
63
-
64
-
65
-
66
-
67
-
68
-
69
-
70
-
71
-
72
-
73
-
74
-
75
-
76
 |
 |

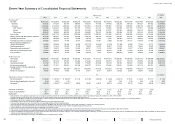
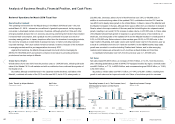
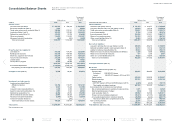
Analysis of Business Results, Financial Position, and Cash Flows
Years ended March 31
1,534
2012 2013 2014 2015 2016
225
425
229
215
303
232
438
257
235
3721,247 1,235 1,331
206 216
1,397
244
391
207
196
293
372
172
175
300
372
183
223
263
3,033.9
2,416.5
617.4
3,406.6
2,745.7
660.9
2,033.1
1,472.9
560.2
2,692.2
2,036.5
655.7
2,205.3
1,617.3
588.0
2012 2013 2014 2015 2016
Years ended March 31
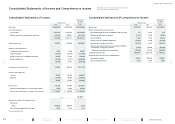
158.8
202.9
134.4
226.8
2012 2013 2014 2015 2016
(38.7)
53.9 34.3
(107.7)
135.7
182.1
Volume and mix
+56.0
YoY +23.9
Foreign exchange
(42.4)
Cost
improvements
+43.7
Marketing
expenses
+1.7
Others
(35.1)
202.9 226.8
2015 2016
Years ended March 31
Review of Operations for March 2016 Fiscal Year
Operating Environment
The operating environment for the Mazda Group in the March 2016 fi scal year – the year
ended March 31, 2016 – showed an overall trend of gradual improvement, led by ongoing
recoveries in developed market economies. Overseas, although growth in China and other
emerging markets slowed, the U.S. economy was strong, stemming from factors that included
increased retail consumption, and a gradual recovery continued in Europe as a result of
monetary easing policies. In Japan, despite an effect from the slowdown in emerging markets,
the economy showed an overall trend of gradual recovery on factors including improved
corporate earnings. The future outlook remains uncertain, however, because of the slowdown
in emerging markets and the yen’s appreciation since early 2016.
Against this backdrop, the Mazda Group pursued structural reforms leveraging its
SKYACTIV TECHNOLOGY and worked to enhance brand value by providing attractive
products and services unique to Mazda.
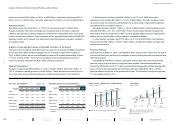
Global Sales Volume
Global sales volume rose 9.8% from the previous year, to 1,534,000 units, refl ecting full-scale
sales of the Mazda CX-3 in all markets and with a contribution from continued strong sales of
the Mazda CX-5.
By market, although overall demand in the Japanese market declined, solid sales of the
Mazda2, combined with sales of the CX-3 and the new MX-5, led to 3.5% sales growth, to
232,000 units. Overseas, sales volume in North America rose 3.0%, to 438,000 units. In
addition to continued strong sales of the updated CX-5, contributions from the CX-3 and the
new MX-5 led to steady sales growth in the United States. In Mexico, sales of the Mazda2 and
the Mazda3 increased. In Europe, although there was an effect from a contraction in demand in
Russia, sales in the major markets of Germany and the United Kingdom far outpaced market
growth, resulting in an overall 12.0% increase in sales volume, to 257,000 units. In China, sales
of the Mazda3 showed high growth in response to a government policy of tax reductions on
small cars, and strong sales of the updated CX-5 and the Mazda6 resulted in overall growth of
9.5%, to 235,000 units. Sales volume in other markets grew 22.6%, to 372,000 units. In the
major market of Australia, both sales volume and market share rose from the previous year as
a result of contributions from the CX-3 and the new MX-5. In the ASEAN market, large sales
growth was recorded in countries including Thailand and Vietnam, and in other emerging
markets record sales were achieved in such countries as Saudi Arabia and Colombia.
Consolidated wholesales rose 9.2% from the previous year, to 1,307,000 units.
Net Sales
Net sales totaled ¥3,406.6 billion, an increase of ¥372.7 billion, or 12.3%, from the previous
year, refl ecting global sales growth of SKYACTIV-equipped models. By region, domestic sales
rose ¥43.5 billion, or 7.1%, to ¥660.9 billion, and overseas sales grew ¥329.2 billion, or 13.6%,
to ¥2,745.7 billion.
By product, vehicle sales rose ¥361.1 billion, or 14.4%, to ¥2,861.5 billion, resulting from
growth in unit sales and an improved model mix. Sales of knockdown parts for overseas
Sales Trends by Major Markets
(Thousands of units)
■ Japan ■ North America ■ Europe ■ China
■ Other markets
■ Domestic ■ Overseas ■ Operating Income (Loss)
■ Net Income (Loss) Attributable to Owners of the Parent
■ Improvement ■ Deterioration
Net Sales
(Billions of yen)
Operating Income (Loss) / Net Income (Loss)
Attributable to Owners of the Parent
(Billions of yen)
Operating Income Change
(Billions of yen)
MAZDA ANNUAL REPORT 2016
42 Financial Section
Message from
Management
Review of Operations
Drivers of Value Creation
Foundations Underpinning
Sustainable Growth
Contents