Mazda 2016 Annual Report Download - page 43
Download and view the complete annual report
Please find page 43 of the 2016 Mazda annual report below. You can navigate through the pages in the report by either clicking on the pages listed below, or by using the keyword search tool below to find specific information within the annual report.-
 1
1 -
2
-
3
-
4
-
5
-
6
-
7
-
8
-
9
-
10
-
11
-
12
-
13
-
14
-
15
-
16
-
17
-
18
-
19
-
20
-
21
-
22
-
23
-
24
-
25
-
26
-
27
-
28
-
29
-
30
-
31
-
32
-
 33
33 -
 34
34 -
 35
35 -
 36
36 -
 37
37 -
 38
38 -
 39
39 -
 40
40 -
 41
41 -
 42
42 -
 43
43 -
 44
44 -
 45
45 -
 46
46 -
 47
47 -
 48
48 -
 49
49 -
 50
50 -
 51
51 -
 52
52 -
 53
53 -
54
-
55
-
56
-
57
-
58
-
59
-
60
-
61
-
62
-
63
-
64
-
65
-
66
-
67
-
68
-
69
-
70
-
71
-
72
-
73
-
74
-
75
-
76
 |
 |

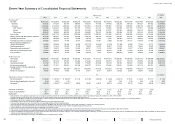
Millions of yen
Thousands of
U.S. dollars*1
2016 2015 2014 2013 2012 2011 2010 2009 2008 2007 2006 2016
For the year*2:
Net sales ¥3,406,603 ¥3,033,899 ¥2,692,238 ¥2,205,270 ¥2,033,058 ¥2,325,689 ¥2,163,949 ¥2,535,902 ¥3,475,789 ¥3,247,485 ¥2,919,823 $30,146,929
Domestic 660,935 617,397 655,716 588,042 560,216 541,490 574,982 620,336 880,132 887,327 887,662 5,848,982
Overseas 2,745,668 2,416,502 2,036,522 1,617,228 1,472,842 1,784,199 1,588,967 1,915,566 2,595,657 2,360,158 2,032,161 24,297,947
North America 1,158,428 1,022,247 834,803 651,165 575,633 631,327 574,640 697,600 1,015,315 1,017,874 843,988 10,251,575
Europe 688,984 613,367 534,937 347,918 347,346 427,398 477,337 653,382 888,555 789,135 668,941 6,097,204
Other areas 898,256 780,888 666,782 618,145 549,863 725,474 536,990 564,584 691,787 553,149 519,232 7,949,168
Cost of sales 2,567,465 2,247,720 1,993,643 1,729,296 1,662,592 1,863,678 1,710,699 2,021,851 2,485,905 2,322,644 2,110,934 22,720,929
Selling, general and administrative expenses 612,363 583,291 516,474 422,038 409,184 438,176 443,792 542,432 827,737 766,309 685,454 5,419,142
Operating income/(loss) 226,775 202,888 182,121 53,936 (38,718) 23,835 9,458 (28,381) 162,147 158,532 123,435 2,006,858
Income/(loss) before income taxes 166,986 209,335 97,409 39,101 (55,262) 16,081 (7,265) (51,339) 143,117 118,450 117,468 1,477,752
Net income/(loss) attributable to
owners of the parent*3134,419 158,808 135,699 34,304 (107,733) (60,042) (6,478) (71,489) 91,835 73,744 66,711 1,189,549
Capital expenditures*489,214 131,010 133,216 77,190 78,040 44,722 29,837 81,838 75,518 79,641 72,070 789,504
Depreciation and amortization*578,972 68,872 57,656 59,954 68,791 71,576 76,428 84,043 74,217 47,045 45,805 698,867
Research and development costs 116,610 108,378 99,363 89,930 91,716 90,961 85,206 95,967 114,400 107,553 95,730 1,031,947
Free cash flow*6154,678 108,911 16,322 8,746 (79,415) 1,627 67,394 (129,244) 10,209 20,995 33,611 1,368,832
At the year-end:
Total assets ¥2,548,401 ¥2,473,287 ¥2,246,036 ¥1,978,567 ¥1,915,943 ¥1,771,767 ¥1,947,769 ¥1,800,981 ¥1,985,566 ¥1,907,752 ¥1,788,659 $22,552,221
Net assets*7976,723 891,326 676,837 513,226 474,429 430,539 509,815 414,731 554,154 479,882 407,208 8,643,566
Interest-bearing debt 617,132 701,019 742,735 718,983 778,085 693,000 722,128 753,355 504,979 474,684 455,409 5,461,345
Net interest-bearing debt 48,418 171,871 262,981 274,108 300,778 370,151 375,825 532,631 281,085 232,179 246,751 428,478
Average number of shares outstanding
(in thousands) 597,819 597,823*12 597,829*12 2,989,171 1,863,949 1,770,198 1,519,652 1,371,456 1,408,368 1,402,315 1,294,533
Number of employees 46,398 44,035 40,892 37,745 37,617 38,117 38,987 39,852 39,364 38,004 36,626
Yen U.S. dollars*1
Amounts per share of common stock:
Net income/(loss)*8¥ 224.85 ¥ 265.64*12 ¥ 226.99*12 ¥ 11.48 ¥ (57.80) ¥ (33.92) ¥ (4.26) ¥ (52.13) ¥ 65.21 ¥ 52.59 ¥ 51.53 $ 1.99
Cash dividends applicable to the year*930.00 10.00 1.00 — — — 3.00 3.00 6.00 6.00 5.00 0.27
Net assets*10 1,595.83 1,454.61*12 1,105.21*12 166.04 156.85 242.24 286.92 314.98 391.82 336.45 284.28 14.12
%
Operating income ratio 6.7% 6.7% 6.8% 2.4% (1.9)% 1.0 % 0.4 % (1.1)% 4.7% 4.9% 4.2%
Return on equity (ROE)*11 14.7 20.8 23.5 7.1 (24.0) (12.8) (1.4) (14.8) 17.9 16.9 20.0
Equity ratio*11 37.4*13 35.2 29.4 25.1 24.5 24.2 26.1 22.9 27.8 24.8 22.3
* 1 The translation of the Japanese yen amounts into U.S. dollars is presented solely for the convenience of readers outside of Japan, using the prevailing exchange rate on March 31, 2016, of ¥113 to US$1.
2 Results information for the March 2011 fiscal year include 15-month results for certain overseas subsidiaries that changed their fiscal year-end.
3 Effective from the March 2016 fiscal year, the presentation of “Net income/(loss)” has been changed to “Net income/(loss) attributable to owners of the parent.” In addition, “minority interests” has been changed to “non-controlling interests.”
4 Capital expenditures are calculated on an accrual basis.
5 Amortization expenses are not included for the March 2007 fiscal year and preceding fiscal years.
6 Free cash flow represents the sum of net cash flows from operating activities and from investing activities.
7 Prior-year amounts have been reclassified to conform to figures for the March 2007 fiscal year and subsequent fiscal years presentation to include non-controlling interests.
8 The computations of net income/(loss) per share of common stock are based on the average number of shares outstanding during each fiscal year.
9 Cash dividends per share represent actual amounts applicable to the respective years.
10 The amounts of net assets used in the calculation of net assets per share exclude non-controlling interests (and, from the March 2007 fiscal year to the March 2013 fiscal year, stock acquisition rights) from net assets.
11 The amounts of equity exclude non-controlling interests (and, from the March 2007 fiscal year to the March 2013 fiscal year, stock acquisition rights) from net assets.
12 A share consolidation was implemented on common stock with a ratio of five shares to one share on August 1, 2014. Average number of shares outstanding, net income per share and net assets per share are calculated based on the assumption that consolidation of shares had been
carried out at the beginning of the March 2014 fiscal year.
13 Percentage after consideration of the equity credit attributes of the subordinated loan is 38.8%.
Eleven-Year Summary of Consolidated Financial Statements Mazda Motor Corporation and Consolidated Subsidiaries
Years ended March 31
MAZDA ANNUAL REPORT 2016
41 Financial Section
Message from
Management
Review of Operations
Drivers of Value Creation
Foundations Underpinning
Sustainable Growth
Contents