Mazda 2016 Annual Report Download - page 42
Download and view the complete annual report
Please find page 42 of the 2016 Mazda annual report below. You can navigate through the pages in the report by either clicking on the pages listed below, or by using the keyword search tool below to find specific information within the annual report.-
 1
1 -
2
-
3
-
4
-
5
-
6
-
7
-
8
-
9
-
10
-
11
-
12
-
13
-
14
-
15
-
16
-
17
-
18
-
19
-
20
-
21
-
22
-
23
-
24
-
25
-
26
-
27
-
28
-
29
-
30
-
31
-
 32
32 -
 33
33 -
 34
34 -
 35
35 -
 36
36 -
 37
37 -
 38
38 -
 39
39 -
 40
40 -
 41
41 -
 42
42 -
 43
43 -
 44
44 -
 45
45 -
 46
46 -
 47
47 -
 48
48 -
 49
49 -
 50
50 -
 51
51 -
 52
52 -
53
-
54
-
55
-
56
-
57
-
58
-
59
-
60
-
61
-
62
-
63
-
64
-
65
-
66
-
67
-
68
-
69
-
70
-
71
-
72
-
73
-
74
-
75
-
76
 |
 |

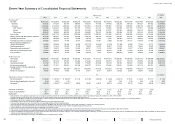
Financial and Non-Financial Highlights
Global Sales Volume / SKYACTIV Ratio
(Thousands of units / %)
Net Income Attributable to Owners of
the Parent / Return on Equity (ROE)
(Billions of yen / %)
Net Sales
(Billions of yen)
Equity / Equity Ratio
(Billions of yen / %)
Operating Income (Loss) /
Operating Income Ratio
(Billions of yen / %)
Net Interest-Bearing Debt /
Net Debt-to-Equity Ratio
(Billions of yen / %)
CO2 Emissions from Mazda’s Four Principal
Domestic Sites* / CO2 Emissions per Unit
of Sales Revenue
(Thousands of tons-CO2/year / t-CO2/¥100 million)
Number of Employees in Japan / Overseas
(People)
* CO2 emissions at Mazda’s four principal domestic sites are calculated using the CO2 coefficient for each year based on standards from the Japan Automobile Manufacturers Association Inc. (JAMA) (Commitment to a Low Carbon Society). Data for the March 2015 fiscal year was
recalculated according to the change of the coefficient. The power coefficient for the March 2016 fiscal year is undetermined as of May 26, 2016; the March 2015 fiscal year power coefficient is used for the March 2016 fiscal year. The figures on the CO2 emissions at Mazda’s four
principal domestic sites in the March 2016 fiscal year have been verified by a third party.
2012 2013 2014 2015 2016
1,247
31
51
74
86
1,235
1,331 1,397
1,534
2012 2013 2014 2015 2016
468.9
24.5 25.1
29.4
35.2
37.4
496.3
660.7
869.6
954.0
2012 2013 2014 2015 2016
2,033.1 2,205.3
2,692.2
3,033.9
3,406.6
2012 2013 2014 2015 2016
300.8
64.2
55.2
39.8
19.8
5.1
274.1 263.0
171.9
48.4
2012 2013 2014 2015 2016
(38.7)
2.4
(1.9)
6.8 6.7 6.7
53.9
182.1
202.9
226.8
2012 2013 2014 2015 2016
(107.7)
7.1
(24.0)
23.5 20.8 14.7
34.3
135.7 134.4
158.8
2012 2013 2014 2015 2016
527
34.2 31.2
26.9
23.1
20.0
529 553 530 521
2012 2013 2014 2015 2016
3,095 3,397 6,977 9,371 11,184
35,214
34,664
33,915
34,348
34,522
37,617 37,745
40,892
44,035 46,398
Global Sales Volume SKYACTIV Ratio
Equity Equity Ratio Net Interest-Bearing Debt
Net Debt-to-Equity Ratio
CO2 Emissions
CO2 Emissions per Unit of Sales Revenue
Number of Employees in Japan
Number of Employees Overseas
Operating Income (Loss)
Operating Income Ratio
Net Income Attributable to Owners of the Parent
ROE
Years ended
March 31
Years ended
March 31
Years ended
March 31
Years ended
March 31
Years ended
March 31
As of
March 31
As of
March 31
As of
March 31
MAZDA ANNUAL REPORT 2016
40 Financial Section
Message from
Management
Review of Operations
Drivers of Value Creation
Foundations Underpinning
Sustainable Growth
Contents