Mazda 2016 Annual Report Download - page 60
Download and view the complete annual report
Please find page 60 of the 2016 Mazda annual report below. You can navigate through the pages in the report by either clicking on the pages listed below, or by using the keyword search tool below to find specific information within the annual report.-
 1
1 -
2
-
3
-
4
-
5
-
6
-
7
-
8
-
9
-
10
-
11
-
12
-
13
-
14
-
15
-
16
-
17
-
18
-
19
-
20
-
21
-
22
-
23
-
24
-
25
-
26
-
27
-
28
-
29
-
30
-
31
-
32
-
33
-
34
-
35
-
36
-
37
-
38
-
39
-
40
-
41
-
42
-
43
-
44
-
45
-
46
-
47
-
48
-
49
-
 50
50 -
 51
51 -
 52
52 -
 53
53 -
 54
54 -
 55
55 -
 56
56 -
 57
57 -
 58
58 -
 59
59 -
 60
60 -
 61
61 -
 62
62 -
 63
63 -
 64
64 -
 65
65 -
 66
66 -
 67
67 -
 68
68 -
 69
69 -
 70
70 -
71
-
72
-
73
-
74
-
75
-
76
 |
 |
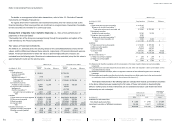
5 SECURITIES
The Group had no trading or held-to-maturity debt securities at March 31, 2016 and 2015.
Available-for-sale securities with market values as of March 31, 2016 and 2015 were as
follows:
Millions of yen Thousands of U.S. dollars
As of March 31, 2016 Acquisition costs Carrying values Difference Acquisition costs Carrying values Difference
Stocks ¥5,138 ¥10,141 ¥5,003 $45,469 $ 89,743 $44,274
Other 2,019 2,306 287 17,867 20,407 2,540
Total ¥7,157 ¥12,447 ¥5,290 $63,336 $110,150 $46,814
Millions of yen
As of March 31, 2015 Acquisition costs Carrying values Difference
Stocks ¥5,180 ¥9,727 ¥4,547
Other 2,308 3,033 725
Total ¥7,488 ¥12,760 ¥5,272
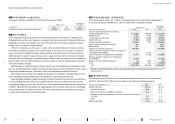
6 INVENTORIES
Inventories as of March 31, 2016 and 2015 were as follows:
Millions of yen
Thousands of
U.S. dollars
As of March 31 2016 2015 2016
Finished products ¥272,097
¥257,788
$2,407,938
Work in process 100,245
111,071
887,124
Raw materials and supplies 11,173
10,643
98,876
Total ¥383,515
¥379,502
$3,393,938
7 LAND REVALUATION
As of March 31, 2001, in accordance with the Law to Partially Revise the Land Revaluation Law
(Law No.19, enacted on March 31, 2001), land owned by the Company for business use was
revalued. The unrealized gains on the revaluation are included in net assets as “Land revaluation”,
net of deferred taxes. The deferred taxes on the unrealized gains are included in liabilities as
“Deferred tax liability related to land revaluation”.
The fair value of land was determined based on official notice prices that are assessed and
published by the Commissioner of the National Tax Administration, as stipulated in Article 2-4 of
the Ordinance Implementing the Law Concerning Land Revaluation (Article 119 of 1998 Cabinet
Order, promulgated on March 31, 1998). Reasonable adjustments, including those for the timing
of assessment, are made to the official notice prices.
The amounts of decrease in the aggregate fair value of the revalued land as of March 31, 2016
and 2015 from that at the time of revaluation, as stipulated in Article 10 of the Land Revaluation
Law, were ¥97,283 million ($860,912 thousand) and ¥98,720 million, respectively.
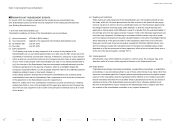
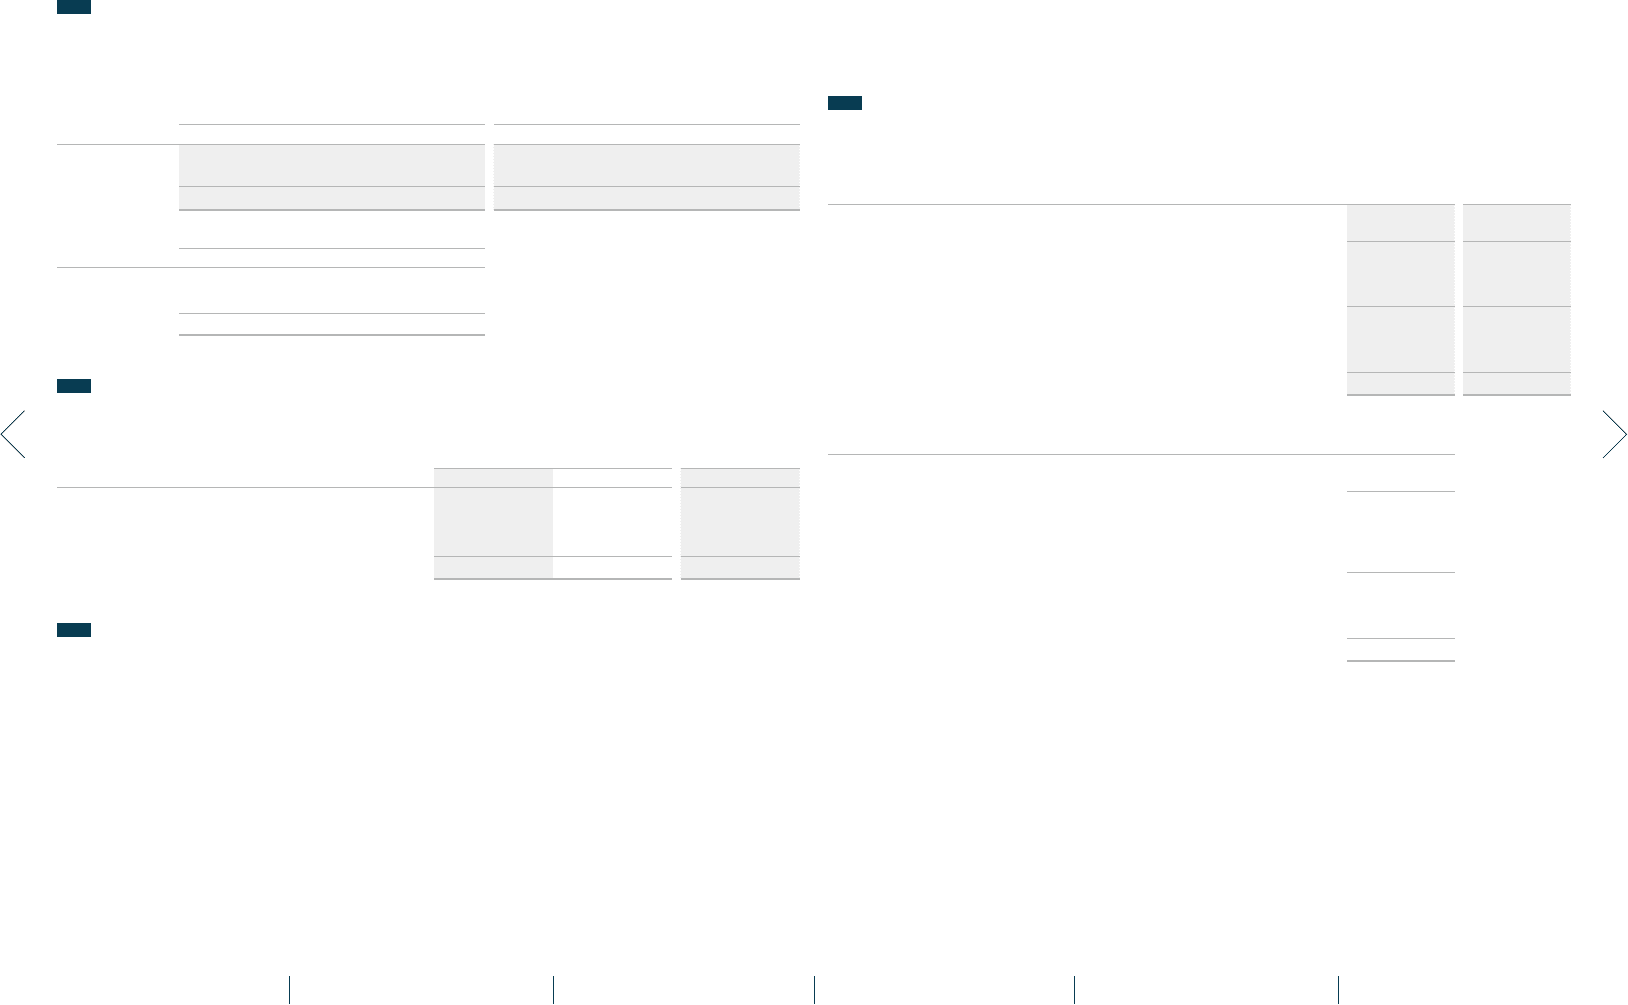
8 IMPAIRMENT LOSS
Details of impairment losses for the years ended March 31, 2016 and 2015 were as follows:
<For the year ended March 31, 2016>
Purpose of use Location Type of assets Millions of yen
Thousands of
U.S. dollars
Idle assets
(Sales facilities)
Ishikawa Prefecture,
Japan, etc.
Buildings and structures, Land, etc.
¥ 364 $ 3,221
Idle assets
(Production facilities)
Hiroshima Prefecture,
Japan, etc.
Machinery, equipment and
vehicles, Software, etc. 772 6,832
Assets for selling Gifu Prefecture,
Japan, etc.
Buildings and structures, Land
29 257
Total ¥1,165 $10,310
<For the year ended March 31, 2015>
Purpose of use Location Type of assets Millions of yen
Idle assets
(Sales facilities)
Fukuoka Prefecture,
Japan, etc.
Buildings and structures, Land, etc.
¥1,149
Idle assets
(Production facilities)
Hiroshima Prefecture,
Japan, etc.
Buildings and structures,
Machinery, equipment and
vehicles, etc.
1,210
Assets for selling Kyoto Prefecture,
Japan
Land
136
Total
¥2,495
For the purpose of reviewing for impairment, the Group has principally grouped its long-lived
assets into asset groups by company; however, idle assets, assets for rent, and assets for selling
are individually reviewed for impairment. The recoverable amounts of these assets were measured
at their net realizable value.
Notes to Consolidated Financial Statements
MAZDA ANNUAL REPORT 2016
58 Financial Section
Message from
Management
Review of Operations
Drivers of Value Creation
Foundations Underpinning
Sustainable Growth
Contents