Mazda 2016 Annual Report Download - page 46
Download and view the complete annual report
Please find page 46 of the 2016 Mazda annual report below. You can navigate through the pages in the report by either clicking on the pages listed below, or by using the keyword search tool below to find specific information within the annual report.-
 1
1 -
2
-
3
-
4
-
5
-
6
-
7
-
8
-
9
-
10
-
11
-
12
-
13
-
14
-
15
-
16
-
17
-
18
-
19
-
20
-
21
-
22
-
23
-
24
-
25
-
26
-
27
-
28
-
29
-
30
-
31
-
32
-
33
-
34
-
35
-
 36
36 -
 37
37 -
 38
38 -
 39
39 -
 40
40 -
 41
41 -
 42
42 -
 43
43 -
 44
44 -
 45
45 -
 46
46 -
 47
47 -
 48
48 -
 49
49 -
 50
50 -
 51
51 -
 52
52 -
 53
53 -
 54
54 -
 55
55 -
 56
56 -
57
-
58
-
59
-
60
-
61
-
62
-
63
-
64
-
65
-
66
-
67
-
68
-
69
-
70
-
71
-
72
-
73
-
74
-
75
-
76
 |
 |

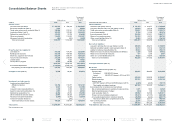
With the recording of ¥134.4 billion of net income attributable to owners of the parent, net
assets totaled ¥976.7 billion, an increase of ¥85.4 billion from the previous fi scal year-end.
The equity ratio rose 2.2 percentage points, to 37.4%, or 38.8% after the recognition of the
equity credit attributes of subordinated loans.
As a result of promoting structural reform initiatives that centered on SKAYACTIV
TECHNOLOGY to realize a stable earnings structure, the Company’s fi nancial position has
been gradually improving.
Cash Flows
Cash and cash equivalents as of the fi scal year-end increased ¥39.6 billion from the end of the
previous fi scal year, to ¥568.7 billion.
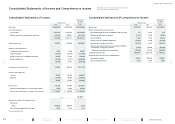
Operating activities provided net cash in the amount of ¥262.8 billion, compared with
¥204.5 billion provided in the previous fi scal year. The main items were ¥167.0 billion of
income before income taxes and ¥79.0 billion of depreciation and amortization.
Investing activities used net cash in the amount of ¥108.1 billion, compared with ¥95.5 billion
used in the previous fi scal year. This was primarily from ¥78.9 billion of outlays for the acquisi-
tion of property, plant and equipment, including capital investment for overseas production
sites such as the new plant in Mexico and a new powertrain plant in Thailand.
As a result, consolidated free cash fl ow (the total of operating cash fl ow and investing cash
fl ow) was positive in the amount of ¥154.7 billion, compared with the previous fi scal year’s
positive free cash fl ow of ¥108.9 billion.
Financing activities used net cash in the amount of ¥94.1 billion, compared with ¥62.8
billion used in the previous fi scal year. This mainly refl ected the reduction of interest-bearing
debts payable and dividend payments.
Basic Dividend Policy, Dividends for March 2016 and March 2017 Fiscal Years
Mazda strives to pay a stable dividend with steady increases, under a basic policy of deter-
mining the dividend amount by comprehensively taking into account the Company’s fi nancial
results for the fi scal year, the business environment, and the Company’s fi nancial position.
For the March 2016 fi scal year, a full-year dividend of ¥30 per share, consisting of a ¥15
per share interim dividend and a ¥15 per share year-end dividend, was paid. We intend to
increase the dividend by ¥5 per share, to ¥35 per share, in the March 2017 fi scal year,
consisting of an interim of ¥15 per share and a year-end dividend of ¥20 per share.
We intend to use internal reserves for research and development and capital investment
for future growth.
Forecast for the March 2017 Fiscal Year
Although an underlying tone of gradual recovery is forecast in developed markets including the
United States and Europe, the economic outlook for the March 2017 fi scal year remains
uncertain given the slowdowns in China and other emerging market economies and exchange
rate movements.
Against this background, under the fi rst year of the new Structural Reform Stage 2
medium-term business plan, the Mazda Group will strive to provide products that demonstrate
Mazda brand value with the appeal of both driving pleasure and outstanding environmental
and safety performance, to enhance brand value through quantitative business growth.
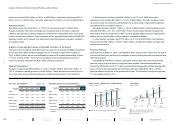
We are projecting a 1.0% increase in global unit sales, to 1,550,000 units. By market, we
are forecasting a 0.3% increase in Japan, to 233,000 units, a 2.5% increase in North America,
to 449,000 units, a 1.3% increase in Europe, to 260,000 units, a 1.3% increase in China, to
238,000 units, and a 0.6% decline in other markets, to 370,000 units.
In terms of consolidated fi nancial forecasts, we are projecting a 3.7% decline in net sales,
to ¥3,280.0 billion, a 25.0% decline in operating income, to ¥170.0 billion, a 21.3% decrease in
ordinary income, to ¥176.0 billion, and a 14.4% decline in net income attributable to owners of
the parent, to ¥115.0 billion. These projections are based on exchange rate assumptions of
¥110 to the U.S. dollar and ¥125 to the euro.
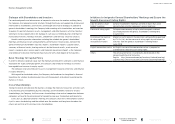
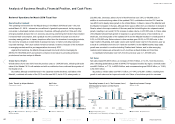
Analysis of Business Results, Financial Position, and Cash Flows
Financial Forecast
(Billions of yen)
(Years ended
March 31) 2016 2017
(Forecast) Difference
Net sales 3,406.6 3,280.0 (126.6)
Operating income 226.8 170.0 (56.8)
Net income attributable
to owners of the parent 134.4 115.0 (19.4)
(Exchange assumptions)
US$/Yen 120 110 (10)
Euro/Yen 133 125 (8)
Forecast for Global Sales Volume
(Thousands of units)
(Years ended
March 31) 2016 2017
(Forecast) Difference
Japan 232 233 1
North America 438 449 11
Europe 257 260 3
China 235 238 3
Other markets 372 370 (2)
Total 1,534 1,550 16
MAZDA ANNUAL REPORT 2016
44 Financial Section
Message from
Management
Review of Operations
Drivers of Value Creation
Foundations Underpinning
Sustainable Growth
Contents