Mazda 2016 Annual Report Download - page 15
Download and view the complete annual report
Please find page 15 of the 2016 Mazda annual report below. You can navigate through the pages in the report by either clicking on the pages listed below, or by using the keyword search tool below to find specific information within the annual report.-
 1
1 -
2
-
3
-
4
-
 5
5 -
 6
6 -
 7
7 -
 8
8 -
 9
9 -
 10
10 -
 11
11 -
 12
12 -
 13
13 -
 14
14 -
 15
15 -
 16
16 -
 17
17 -
 18
18 -
 19
19 -
 20
20 -
 21
21 -
 22
22 -
 23
23 -
 24
24 -
 25
25 -
26
-
27
-
28
-
29
-
30
-
31
-
32
-
33
-
34
-
35
-
36
-
37
-
38
-
39
-
40
-
41
-
42
-
43
-
44
-
45
-
46
-
47
-
48
-
49
-
50
-
51
-
52
-
53
-
54
-
55
-
56
-
57
-
58
-
59
-
60
-
61
-
62
-
63
-
64
-
65
-
66
-
67
-
68
-
69
-
70
-
71
-
72
-
73
-
74
-
75
-
76
 |
 |

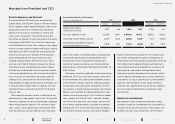
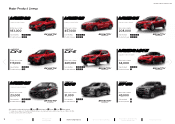
New CX-4 CX-5
Sales Volume
■ Sales Volume (Thousands of units)
Market Share (%)
Sales Volume
■ Sales Volume (Thousands of units)
Market Share (%)
Review by Market
Other Markets
Overview of March 2016 Fiscal Year Results
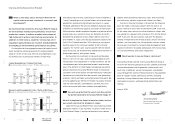
In China, although the market environment weakened during the first half of the year
because of an economic slowdown and a drop in stock prices, tax reductions on small
passenger vehicles with engine displacements of 1.6 liters or smaller led to a 5% increase
in total demand for the full year, to 24.97 million units. Mazda’s sales volume grew 10%, to
235,000 units, with the tax cut leading to strong sales of the Mazda3 Axela, as well as with
contributions from the updated CX-5 and from the Mazda6 Atenza.
The number of dealerships in China stood at 468 as of March 31, 2016, an increase of
13 from the end of the previous fiscal year. We will continue to strengthen our network by
opening new showrooms while also reinforcing the earnings base at existing showrooms.
March 2017 Fiscal Year Forecast
Despite tax reductions and other government economic stimulus measures, the same
level of growth that resulted when similar measures were implemented in 2009 cannot
be expected, and there are also concerns that total demand may fall after the expiry of the
tax reductions from January 2017. Against this backdrop, Mazda is projecting a roughly
flat sales volume of 238,000 units. We expect to maintain the previous year’s level of
strong sales of the three SKYACTIV-equipped models – the Mazda6 Atenza, the Mazda3
Axela, and the CX-5 – along with a contribution from the new Mazda CX-4 crossover SUV
launched in June 2016.
Australia Although total demand in the March 2016 fiscal year rose 3%, to 1.16
million units, Mazda continued to post strong sales, with 15% growth in sales volume, to
116,000 units, and an increase in market share to 10% from 9%. This growth was driven by
the launches of the CX-3 and new MX-5, as well as with the CX-5 maintaining its lead in
sales volume for the sector for the sixteenth consecutive quarter since its full-scale launch
in the first quarter of 2012.
We are projecting a 2% increase in the March 2017 fiscal year, to 118,000 units, with
market share remaining flat at 10%, stemming from strong sales of the CX-3 and CX-5
combined with the introduction of the new CX-9.
ASEAN Mazda’s sales volume in the ASEAN market rose 32% in the March 2016
fiscal year, to 101,000 units, surpassing 100,000 units for the second time and the first
time since the March 2013 fiscal year. In Thailand, despite a third consecutive year of lower
total demand, Mazda’s sales volume grew 23%, to 42,000 units, with contributions from
the fully remodeled Mazda2 introduced in January 2015 and the CX-3, newly launched in
November 2015. In addition, record sales volumes were recorded in Malaysia, Vietnam, the
Philippines, Singapore, and Cambodia.
For the March 2017 fiscal year, we are projecting a 5% increase, to 106,000 units,
mainly from continued market growth in Vietnam and an anticipated increase in issuances
of Certificates of Entitlement for purchasing vehicles in Singapore.
Mazda’s overall sales volumes in other markets, including Australia and ASEAN, rose 23%
in the March 2016 fiscal year, to 372,000 units. We are projecting a 1% decline in the March
2017 fiscal year, to 370,000 units.
China
0.9
175
2013 2014 2015 2016 2017
196 215 235 238
0.9 0.9 0.9
(Forecast)
300
2013 2014 2015 2016 2017
293 303
372 370
(Forecast)
Years ended
March 31
Years ended
March 31
MAZDA ANNUAL REPORT 2016
13 Review of Operations
Drivers of Value Creation
Foundations Underpinning
Sustainable Growth
Financial Section
Message from
Management
Contents