Mazda 2016 Annual Report Download - page 52
Download and view the complete annual report
Please find page 52 of the 2016 Mazda annual report below. You can navigate through the pages in the report by either clicking on the pages listed below, or by using the keyword search tool below to find specific information within the annual report.-
 1
1 -
2
-
3
-
4
-
5
-
6
-
7
-
8
-
9
-
10
-
11
-
12
-
13
-
14
-
15
-
16
-
17
-
18
-
19
-
20
-
21
-
22
-
23
-
24
-
25
-
26
-
27
-
28
-
29
-
30
-
31
-
32
-
33
-
34
-
35
-
36
-
37
-
38
-
39
-
40
-
41
-
 42
42 -
 43
43 -
 44
44 -
 45
45 -
 46
46 -
 47
47 -
 48
48 -
 49
49 -
 50
50 -
 51
51 -
 52
52 -
 53
53 -
 54
54 -
 55
55 -
 56
56 -
 57
57 -
 58
58 -
 59
59 -
 60
60 -
 61
61 -
 62
62 -
63
-
64
-
65
-
66
-
67
-
68
-
69
-
70
-
71
-
72
-
73
-
74
-
75
-
76
 |
 |

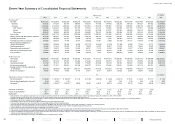
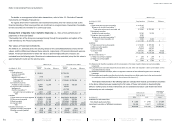
Millions of yen
Net assets attributable to owners of the parent
Total
net assets
Capital and retained earnings Accumulated other comprehensive income/(loss)
Common stock Capital surplus
Retained
earnings Treasury stock Total
Net unrealized gain/
(loss) on available-
for-sale securities
Deferred gains/
(losses) on
hedges Land revaluation
Foreign
currency
translation
adjustment
Accumulated
adjustments
for retirement
benefits
Non-controlling
interests
April 1, 2014
¥258,957 ¥242,649 ¥ 89,424 ¥(2,204) ¥588,826 ¥1,152 ¥(1,223) ¥135,541 ¥(55,586) ¥(7,988) ¥16,115 ¥676,837
C umulative effects of changes in
accounting policies — — 2,841 — 2,841 — — — — — (52) 2,789
Restated balance
258,957 242,649 92,265 (2,204) 591,667 1,152 (1,223) 135,541 (55,586) (7,988) 16,063 679,626
Increase/(decrease)
Dividends paid — — (2,989) — (2,989) — — — — — — (2,989)
Net income attributable to owners of the parent — — 158,808 — 158,808 — — — — — — 158,808
Purchase of treasury stock — — — (18) (18) — — — — — — (18)
Sale of treasury stock — 1 — 0 1 — — — — — — 1
Reversal for land revaluation — — 10 — 10 — — — — — — 10
C hange in treasury shares of parent arising from
transactions with non-controlling shareholders — — — — — — — — — — — —
C hanges in items other than capital
and retained earnings, net — — — — — 2,529 1,891 7,045 34,210 4,545 5,668 55,888
Total changes during the fiscal year
— 1 155,829 (18) 155,812 2,529 1,891 7,045 34,210 4,545 5,668 211,700
April 1, 2015
¥258,957 ¥242,650 ¥248,094 ¥(2,222) ¥747,479 ¥3,681 ¥ 668 ¥142,586 ¥(21,376) ¥(3,443) ¥21,731 ¥891,326
C umulative effects of changes in
accounting policies
— — — — — — — — — — — —
Restated balance 258,957 242,650 248,094 (2,222) 747,479 3,681 668 142,586 (21,376) (3,443) 21,731 891,326
Increase/(decrease)
Dividends paid
— — (14,946) — (14,946) — — — — — — (14,946)
Net income attributable to owners of the parent
— — 134,419 — 134,419 — — — — — — 134,419
Purchase of treasury stock
— — — (6) (6) — — — — — — (6)
Sale of treasury stock
— 0 — 0 0 — — — — — — 0
Reversal for land revaluation
— — 34 — 34 — — — — — — 34
C hange in treasury shares of parent arising from
transactions with non-controlling shareholders
— 398 — — 398 — — — — — — 398
C hanges in items other than capital
and retained earnings, net
— — — — — 40 (1,268) 3,366 (15,501) (22,115) 976 (34,502)
Total changes during the fiscal year — 398 119,507 (6) 119,899 40 (1,268) 3,366 (15,501) (22,115) 976 85,397
March 31, 2016 ¥258,957 ¥243,048 ¥367,601 ¥(2,228) ¥867,378 ¥3,721 ¥ (600) ¥145,952 ¥(36,877) ¥(25,558) ¥22,707 ¥976,723
Thousands of U.S. dollars (Note 1)
Net assets attributable to owners of the parent
Total net
assets
Capital and retained earnings Accumulated other comprehensive income/(loss)
Common stock Capital surplus
Retained
earnings Treasury stock Total
Net unrealized gain/
(loss) on available-
for-sale securities
Deferred gains/
(losses) on
hedges Land revaluation
Foreign
currency
translation
adjustment
Accumulated
adjustments
for retirement
benefits
Non-controlling
interests
April 1, 2015
$2,291,655 $2,147,345 $2,195,522 $(19,664) $6,614,858 $32,575 $ 5,912 $1,261,823 $(189,168) $ (30,469) $192,310 $7,887,841
C umulative effects of changes in
accounting policies
— — — — — — — — — — — —
Restated balance 2,291,655 2,147,345 2,195,522 (19,664) 6,614,858 32,575 5,912 1,261,823 (189,168) (30,469) 192,310 7,887,841
Increase/(decrease)
Dividends paid
— — (132,266) — (132,266) — — — — — — (132,266)
Net income attributable to owners of the parent
— — 1,189,549 — 1,189,549 — — — — — — 1,189,549
Purchase of treasury stock
— — — (53) (53) — — — — — — (53)
Sale of treasury stock
— 0 — 0 0 — — — — — — 0
Reversal for land revaluation
— — 301 — 301 — — — — — — 301
C hange in treasury shares of parent arising from
transactions with non-controlling shareholders
— 3,522 — — 3,522 — — — — — — 3,522
C hanges in items other than capital
and retained earnings, net
— — — — — 354 (11,222) 29,788 (137,177) (195,708) 8,637 (305,328)
Total changes during the fiscal year — 3,522 1,057,584 (53) 1,061,053 354 (11,222) 29,788 (137,177) (195,708) 8,637 755,725
March 31, 2016 $2,291,655 $2,150,867 $3,253,106 $(19,717) $7,675,911 $32,929 $ (5,310) $1,291,611 $(326,345) $(226,177) $200,947 $8,643,566
See accompanying notes.
Consolidated Statements of Changes in Net Assets Mazda Motor Corporation and Consolidated Subsidiaries
Years ended March 31, 2016 and 2015
MAZDA ANNUAL REPORT 2016
50 Financial Section
Message from
Management
Review of Operations
Drivers of Value Creation
Foundations Underpinning
Sustainable Growth
Contents