Mazda 2016 Annual Report Download - page 53
Download and view the complete annual report
Please find page 53 of the 2016 Mazda annual report below. You can navigate through the pages in the report by either clicking on the pages listed below, or by using the keyword search tool below to find specific information within the annual report.-
 1
1 -
2
-
3
-
4
-
5
-
6
-
7
-
8
-
9
-
10
-
11
-
12
-
13
-
14
-
15
-
16
-
17
-
18
-
19
-
20
-
21
-
22
-
23
-
24
-
25
-
26
-
27
-
28
-
29
-
30
-
31
-
32
-
33
-
34
-
35
-
36
-
37
-
38
-
39
-
40
-
41
-
42
-
 43
43 -
 44
44 -
 45
45 -
 46
46 -
 47
47 -
 48
48 -
 49
49 -
 50
50 -
 51
51 -
 52
52 -
 53
53 -
 54
54 -
 55
55 -
 56
56 -
 57
57 -
 58
58 -
 59
59 -
 60
60 -
 61
61 -
 62
62 -
 63
63 -
64
-
65
-
66
-
67
-
68
-
69
-
70
-
71
-
72
-
73
-
74
-
75
-
76
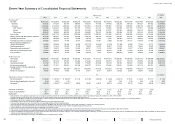
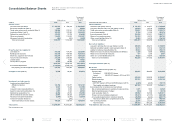
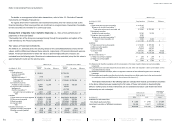
 |
 |

Millions of yen
Thousands of
U.S. dollars
(Note 1)
2016 2015 2016
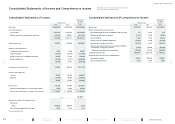
Cash flows from operating activities:
Income before income taxes ¥ 166,986 ¥ 209,335 $1,477,752
A djustments to reconcile income before income taxes to
net cash provided by/(used in) operating activities:
Depreciation and amortization 78,972 68,872 698,867
Impairment loss 1,165 2,495 10,310
Increase/(decrease) in allowance for doubtful receivables (21) (20) (186)
Increase/(decrease) in reserve for warranty expenses 59,006 13,683 522,177
In crease/(decrease) in reserve for loss on business
of subsidiaries and affiliates 5,655 (6,131) 50,044
In crease/(decrease) in reserve for environmental
measures (413) (484) (3,655)
Increase/(decrease) in liability for retirement benefits (6,368) (2,596) (56,354)
Interest and dividend income (4,347) (4,268) (38,469)
Interest expense 12,859 13,706 113,796
Equity in net loss/(income) of affiliated companies (21,988) (17,216) (194,584)
Lo ss/(gain) on sale and retirement of property, plant and
equipment, net 5,868 5,608 51,929
Decrease/(increase) in trade notes and accounts receivable 14,561 (30,252) 128,858
Decrease/(increase) in inventories (27,151) (49,403) (240,274)
Increase/(decrease) in trade notes and accounts payable (3,968) 46,568 (35,115)
Increase/(decrease) in other current liabilities (8,420) 24,710 (74,513)
Other 18,004 (45,467) 159,329
Subtotal 290,400 229,140 2,569,912
Interest and dividends received 15,980 4,898 141,416
Interest paid (13,177) (14,081) (116,611)
Income taxes refunded/(paid) (30,433) (15,498) (269,319)
Net cash provided by/(used in) operating activities ¥ 262,770 ¥ 204,459 $2,325,398
Millions of yen
Thousands of
U.S. dollars
(Note 1)
2016 2015 2016
Cash flows from investing activities:
Net decrease/(increase) in time deposits ¥ (27,006) ¥ 988 $ (238,991)
Net decrease/(increase) in securities (3,000) — (26,549)
Purchase of investment securities (3,242) (1,907) (28,690)
Proceeds from sales and redemption of investment securities 3,549 40,810 31,407
Acquisition of property, plant and equipment (78,904) (123,370) (698,265)
Proceeds from sale of property, plant and equipment 8,761 1,476 77,531
Acquisition of intangible assets (9,175) (12,758) (81,195)
Net decrease/(increase) in short-term loans receivable 71 (784) 628
Payments of long-term loans receivable (795) (592) (7,035)
Collections of long-term loans receivable 1,873 1,075 16,575
Other (224) (486) (1,982)
Net cash provided by/(used in) investing activities (108,092) (95,548) (956,566)
Cash flows from financing activities:
Net increase/(decrease) in short-term debt (50) 11,909 (442)
Proceeds from long-term debt 17,119 38,505 151,496
Repayments of long-term debt (96,440) (110,184) (853,451)
Proceeds from stock issuance to non-controlling shareholders 297 —2,628
Cash dividends paid (14,946) (2,989) (132,266)
Cash dividends paid to non-controlling interests (36) — (319)
Net decrease/(increase) in treasury stock (6) (17) (53)
Net cash provided by/(used in) financing activities (94,062) (62,776) (832,407)
Effect of exchange rate fluctuations on cash and
cash equivalents (21,050) 3,259 (186,283)
Net increase/(decrease) in cash and cash equivalents 39,566 49,394 350,142
Cash and cash equivalents at beginning of the period 529,148 479,754 4,682,725
Cash and cash equivalents at end of the period ¥ 568,714 ¥ 529,148 $5,032,867
See accompanying notes.
Consolidated Statements of Cash Flows Mazda Motor Corporation and Consolidated Subsidiaries
Years ended March 31, 2016 and 2015
MAZDA ANNUAL REPORT 2016
51 Financial Section
Message from
Management
Review of Operations
Drivers of Value Creation
Foundations Underpinning
Sustainable Growth
Contents