Mazda 2016 Annual Report Download - page 62
Download and view the complete annual report
Please find page 62 of the 2016 Mazda annual report below. You can navigate through the pages in the report by either clicking on the pages listed below, or by using the keyword search tool below to find specific information within the annual report.-
 1
1 -
2
-
3
-
4
-
5
-
6
-
7
-
8
-
9
-
10
-
11
-
12
-
13
-
14
-
15
-
16
-
17
-
18
-
19
-
20
-
21
-
22
-
23
-
24
-
25
-
26
-
27
-
28
-
29
-
30
-
31
-
32
-
33
-
34
-
35
-
36
-
37
-
38
-
39
-
40
-
41
-
42
-
43
-
44
-
45
-
46
-
47
-
48
-
49
-
50
-
51
-
 52
52 -
 53
53 -
 54
54 -
 55
55 -
 56
56 -
 57
57 -
 58
58 -
 59
59 -
 60
60 -
 61
61 -
 62
62 -
 63
63 -
 64
64 -
 65
65 -
 66
66 -
 67
67 -
 68
68 -
 69
69 -
 70
70 -
 71
71 -
 72
72 -
73
-
74
-
75
-
76
 |
 |

Millions of yen
Thousands of
U.S. dollars
For the years ended March 31 2016 2015 2016
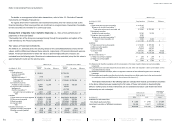
Movements in plan assets:
Balance at beginning of year ¥254,906
¥233,516
$2,255,805
Expected return on plan assets 4,751
4,579
42,044
Actuarial gains/(losses) (5,110)
13,602
(45,221)
Contributions paid by the employer 13,335
12,961
118,009
Benefits paid (11,951)
(12,515)
(105,761)
Other (1,543)
2,763
(13,655)
Balance at end of year ¥254,388
¥254,906
$2,251,221
The reconciliation of the retirement benefit obligations and plan assets to the liability and asset
for retirement benefits recognized in the consolidated balance sheets of March 31, 2016 and 2015
were as follows:
Millions of yen
Thousands of
U.S. dollars
As of March 31 2016 2015 2016
Funded retirement benefit obligations ¥ 317,775
¥ 294,389
$ 2,812,168
Plan assets (254,388)
(254,906)
(2,251,221)
Subtotal 63,387
39,483
560,947
Unfunded retirement benefit obligations 19,642
19,863
173,823
Total net liability (asset) for retirement benefits
recognized in consolidated balance sheets 83,029
59,346
734,770
Liability for retirement benefits 85,916
62,669
760,319
Asset for retirement benefits (2,887)
(3,323)
(25,549)
Total net liability (asset) for retirement benefits
recognized in consolidated balance sheets ¥ 83,029
¥ 59,346
$ 734,770
The profits and losses related to retirement benefits for the years ended March 31, 2016 and
2015 were as follows:
Millions of yen
Thousands of
U.S. dollars
For the years ended March 31 2016 2015 2016
Service cost ¥11,126
¥ 9,900
$ 98,460
Interest cost 3,864
4,611
34,195
Expected return on plan assets (4,751)
(4,579)
(42,044)
Net actuarial loss amortization 3,943
6,429
34,894
Past service costs amortization (3,107)
(3,132)
(27,496)
Other (31)
3,358
(274)
Severance and retirement benefit expenses ¥11,044
¥16,587
$ 97,735
Note: For the years ended March 31, 2016 and 2015, accrued pension costs related to defined contribution plans were charged to income
as ¥3,661 million ($32,398 thousand) and ¥3,298 million, respectively. This cost is not included in the above.
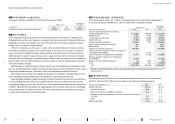
The breakdown of items of adjustments for retirement benefit (before tax) recognized in other
comprehensive income for the years ended March 31, 2016 and 2015 were as follows:
Millions of yen
Thousands of
U.S. dollars
For the years ended March 31 2016 2015 2016
Past service costs ¥ (3,061)
¥(3,132)
$ (27,088)
Actuarial differences (26,941)
6,987
(238,416)
Other (3)
(2)
(27)
Total ¥(30,005)
¥ 3,853
$(265,531)
The breakdown of items of accumulated adjustments for retirement benefits (before tax) recognized
in accumulated other comprehensive income as of March 31, 2016 and 2015 were as follows:
Millions of yen
Thousands of
U.S. dollars
As of March 31 2016 2015 2016
Past service costs that are yet to be recognized ¥ 8,035
¥ 11,096
$ 71,106
Actuarial gains and losses that are yet to
be recognized (42,430)
(15,489)
(375,487)
Other 5
8
45
Total ¥(34,390)
¥ (4,385)
$(304,336)
The breakdown of plan assets by major category as of March 31, 2016 and 2015 were
as follows:
As of March 31 2016 2015
Bonds 43%
41%
Equity securities 25%
29%
General accounts of the life insurance companies 17%
17%
Other 15%
13%
Total 100%
100%
The major items of actuarial assumptions for the years ended March 31, 2016 and 2015 were
as follows:
For the years ended March 31 2016 2015
Discount rate Primarily 0.7%
Primarily 1.1%
Long-term expected rate of return Primarily 1.5%
Primarily 1.5%
Notes to Consolidated Financial Statements
MAZDA ANNUAL REPORT 2016
Financial Section
Message from
Management
Review of Operations
Drivers of Value Creation
Foundations Underpinning
Sustainable Growth
Contents