Macy's 2008 Annual Report Download - page 99
Download and view the complete annual report
Please find page 99 of the 2008 Macy's annual report below. You can navigate through the pages in the report by either clicking on the pages listed below, or by using the keyword search tool below to find specific information within the annual report.-
 1
1 -
2
-
3
-
4
-
5
-
6
-
7
-
8
-
9
-
10
-
11
-
12
-
13
-
14
-
15
-
16
-
17
-
18
-
19
-
20
-
21
-
22
-
23
-
24
-
25
-
26
-
27
-
28
-
29
-
30
-
31
-
32
-
33
-
34
-
35
-
36
-
37
-
38
-
39
-
40
-
41
-
42
-
43
-
44
-
45
-
46
-
47
-
48
-
49
-
50
-
51
-
52
-
53
-
54
-
55
-
56
-
57
-
58
-
59
-
60
-
61
-
62
-
63
-
64
-
65
-
66
-
67
-
68
-
69
-
70
-
71
-
72
-
73
-
74
-
75
-
76
-
77
-
78
-
79
-
80
-
81
-
82
-
83
-
84
-
85
-
86
-
87
-
88
-
 89
89 -
 90
90 -
 91
91 -
 92
92 -
 93
93 -
 94
94 -
 95
95 -
 96
96 -
 97
97 -
 98
98 -
 99
99 -
 100
100 -
 101
101 -
 102
102 -
 103
103 -
 104
104 -
 105
105 -
 106
106 -
 107
107 -
 108
108 -
 109
109
 |
 |

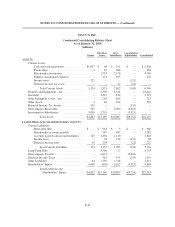
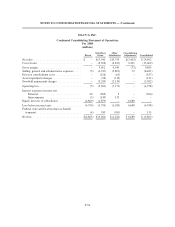
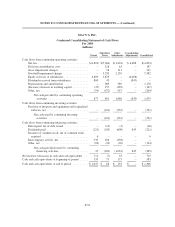
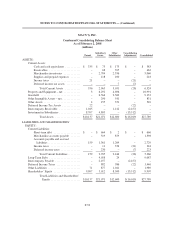
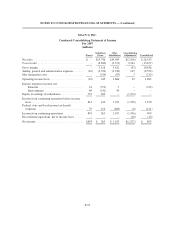
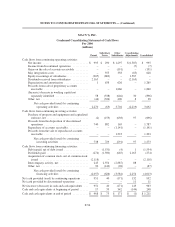
NOTES TO CONSOLIDATED FINANCIAL STATEMENTS — (Continued)
MACY’S, INC.
Condensed Consolidating Statement of Cash Flows
For 2008
(millions)
Parent
Subsidiary
Issuer
Other
Subsidiaries
Consolidating
Adjustments Consolidated
Cash flows from continuing operating activities:
Net loss ................................... $(4,803) $(5,264) $(1,424) $ 6,688 $(4,803)
Division consolidation costs ................... – 126 61 – 187
Asset impairment charges ..................... – 98 113 – 211
Goodwill impairment charges ................. – 3,243 2,139 – 5,382
Equity in losses of subsidiaries ................. 4,809 1,879 – (6,688) –
Dividends received from subsidiaries ........... 800 45 – (845) –
Depreciation and amortization ................. – 689 589 – 1,278
(Increase) decrease in working capital ........... (35) 157 (289) – (167)
Other, net ................................. (94) (572) 457 – (209)
Net cash provided by continuing operating
activities ............................ 677 401 1,646 (845) 1,879
Cash flows from continuing investing activities:
Purchase of property and equipment and capitalized
software, net ............................. – (224) (567) – (791)
Net cash used by continuing investing
activities ............................ – (224) (567) – (791)
Cash flows from continuing financing activities:
Debt repaid, net of debt issued ................. – (13) (3) – (16)
Dividends paid ............................. (221) (245) (600) 845 (221)
Issuance of common stock, net of common stock
acquired ................................ 6 – – – 6
Intercompany activity, net .................... 332 106 (438) – –
Other, net ................................. (82) (32) (20) – (134)
Net cash provided (used) by continuing
financing activities .................... 35 (184) (1,061) 845 (365)
Net increase (decrease) in cash and cash equivalents . . . 712 (7) 18 – 723
Cash and cash equivalents at beginning of period ...... 335 75 173 – 583
Cash and cash equivalents at end of period ........... $1,047 $ 68 $ 191 $ – $ 1,306
F-51