Macy's 2008 Annual Report Download - page 53
Download and view the complete annual report
Please find page 53 of the 2008 Macy's annual report below. You can navigate through the pages in the report by either clicking on the pages listed below, or by using the keyword search tool below to find specific information within the annual report.-
 1
1 -
2
-
3
-
4
-
5
-
6
-
7
-
8
-
9
-
10
-
11
-
12
-
13
-
14
-
15
-
16
-
17
-
18
-
19
-
20
-
21
-
22
-
23
-
24
-
25
-
26
-
27
-
28
-
29
-
30
-
31
-
32
-
33
-
34
-
35
-
36
-
37
-
38
-
39
-
40
-
41
-
42
-
 43
43 -
 44
44 -
 45
45 -
 46
46 -
 47
47 -
 48
48 -
 49
49 -
 50
50 -
 51
51 -
 52
52 -
 53
53 -
 54
54 -
 55
55 -
 56
56 -
 57
57 -
 58
58 -
 59
59 -
 60
60 -
 61
61 -
 62
62 -
 63
63 -
64
-
65
-
66
-
67
-
68
-
69
-
70
-
71
-
72
-
73
-
74
-
75
-
76
-
77
-
78
-
79
-
80
-
81
-
82
-
83
-
84
-
85
-
86
-
87
-
88
-
89
-
90
-
91
-
92
-
93
-
94
-
95
-
96
-
97
-
98
-
99
-
100
-
101
-
102
-
103
-
104
-
105
-
106
-
107
-
108
-
109
 |
 |

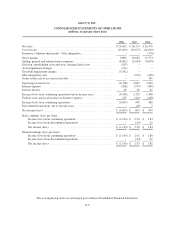
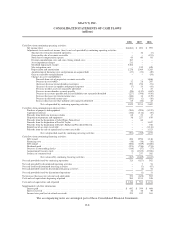
MACY’S, INC.
CONSOLIDATED STATEMENTS OF OPERATIONS
(millions, except per share data)
2008 2007 2006
Net sales ........................................................ $24,892 $ 26,313 $ 26,970
Cost of sales ..................................................... (15,009) (15,677) (16,019)
Inventory valuation adjustments – May integration ....................... – – (178)
Gross margin .................................................... 9,883 10,636 10,773
Selling, general and administrative expenses ............................ (8,481) (8,554) (8,678)
Division consolidation costs and store closing related costs ................ (187) – –
Asset impairment charges .......................................... (211) – –
Goodwill impairment charges ....................................... (5,382) – –
May integration costs .............................................. – (219) (450)
Gains on the sale of accounts receivable ............................... – – 191
Operating income (loss) ............................................ (4,378) 1,863 1,836
Interest expense .................................................. (588) (579) (451)
Interest income ................................................... 28 36 61
Income (loss) from continuing operations before income taxes ............. (4,938) 1,320 1,446
Federal, state and local income tax benefit (expense) ..................... 135 (411) (458)
Income (loss) from continuing operations .............................. (4,803) 909 988
Discontinued operations, net of income taxes ........................... – (16) 7
Net income (loss) ................................................. $ (4,803) $ 893 $ 995
Basic earnings (loss) per share:
Income (loss) from continuing operations .......................... $ (11.40) $ 2.04 $ 1.83
Income (loss) from discontinued operations ........................ – (.04) .01
Net income (loss) ............................................. $ (11.40) $ 2.00 $ 1.84
Diluted earnings (loss) per share:
Income (loss) from continuing operations .......................... $ (11.40) $ 2.01 $ 1.80
Income (loss) from discontinued operations ........................ – (.04) .01
Net income (loss) ............................................. $ (11.40) $ 1.97 $ 1.81
The accompanying notes are an integral part of these Consolidated Financial Statements.
F-5