Macy's 2008 Annual Report Download - page 24
Download and view the complete annual report
Please find page 24 of the 2008 Macy's annual report below. You can navigate through the pages in the report by either clicking on the pages listed below, or by using the keyword search tool below to find specific information within the annual report.-
 1
1 -
2
-
3
-
4
-
5
-
6
-
7
-
8
-
9
-
10
-
11
-
12
-
13
-
 14
14 -
 15
15 -
 16
16 -
 17
17 -
 18
18 -
 19
19 -
 20
20 -
 21
21 -
 22
22 -
 23
23 -
 24
24 -
 25
25 -
 26
26 -
 27
27 -
 28
28 -
 29
29 -
 30
30 -
 31
31 -
 32
32 -
 33
33 -
 34
34 -
35
-
36
-
37
-
38
-
39
-
40
-
41
-
42
-
43
-
44
-
45
-
46
-
47
-
48
-
49
-
50
-
51
-
52
-
53
-
54
-
55
-
56
-
57
-
58
-
59
-
60
-
61
-
62
-
63
-
64
-
65
-
66
-
67
-
68
-
69
-
70
-
71
-
72
-
73
-
74
-
75
-
76
-
77
-
78
-
79
-
80
-
81
-
82
-
83
-
84
-
85
-
86
-
87
-
88
-
89
-
90
-
91
-
92
-
93
-
94
-
95
-
96
-
97
-
98
-
99
-
100
-
101
-
102
-
103
-
104
-
105
-
106
-
107
-
108
-
109
 |
 |
including the projected future cash flows assumed in connection with the Merger, resulting in the Company
recording in the fourth quarter of 2008 a reduction in the carrying value of its goodwill, and a related non-cash
impairment charge, in the estimated amount of $5,382 million.
The effects of the factors and conditions described above may be experienced differently, or at different times,
in the various geographic regions in which the Company operates, in relation to the different types of merchandise
that the Company offers for sale, or in relation to the Company’s Macy’s-branded and Bloomingdale’s-branded
operations. All of these effects, however, ultimately affect the Company’s overall operations.
The Company cannot predict whether, when or the manner in which the economic conditions described above
will change. Based on its assessment of current and anticipated market conditions and its most recent fourth quarter
performance, the Company is assuming that its comparable store sales in 2009 for most of the Company’s operating
divisions and the Company as a whole will be down in the range of 6% to 8% from 2008 levels.
The discussion in this Item 7 should be read in conjunction with our Consolidated Financial Statements and
the related notes included elsewhere in this report. The discussion in this Item 7 contains forward-looking
statements that reflect the Company’s plans, estimates and beliefs. The Company’s actual results could materially
differ from those discussed in these forward-looking statements. Factors that could cause or contribute to those
differences include, but are not limited to, those discussed below and elsewhere in this report, particularly in
“Risk Factors” and “Forward-Looking Statements.”
Results of Operations
Comparison of the 52 Weeks Ended January 31, 2009 and the 53 Weeks Ended February 2, 2008. The net
loss for 2008 was $4,803 million compared to net income of $893 million for 2007. The net loss for 2008 reflects
the lower sales trend and includes the impact of $5,382 million of estimated goodwill impairment charges, $187
million of division consolidation costs and store closing related costs and $211 million of asset impairment
charges. The net income for 2007 included income from continuing operations of $909 million and a loss from
discontinued operations of $16 million. The income from continuing operations in 2007 included the impact of
$219 million of May integration costs. The loss from discontinued operations in 2007 included the loss on
disposal of the After Hours Formalwear business.
Net sales for 2008 totaled $24,892 million, compared to net sales of $26,313 million for 2007, a decrease of
$1,421 million or 5.4%. On a comparable store basis, net sales for 2008 were down 4.6% compared to 2007.
Sales in 2008 were strongest at macys.com and bloomingdales.com and were weakest at Bloomingdale’s, Macy’s
West and Macy’s Florida. 2008 sales at Bloomingdale’s were weakest during the third and fourth quarters. Sales
from the Company’s Internet businesses in 2008 increased 29.0% compared to 2007 and positively affected the
Company’s 2008 comparable store sales by 0.8%. The Company continues to be encouraged by the sales
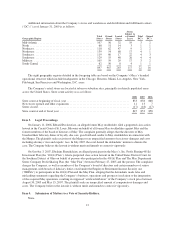
performance in the piloted My Macy’s districts. Sales of the Company’s private label brands represented
approximately 19% of net sales in the Macy’s-branded stores in both 2008 and 2007. By family of business, sales
in 2008 were strongest in young men’s apparel, shoes and housewares. The weaker businesses during 2008 were
women’s apparel and furniture. The Company calculates comparable store sales as sales from stores in operation
throughout 2007 and 2008 and all Internet sales. Stores undergoing remodeling, expansion or relocation remain
in the comparable store sales calculation unless the store is closed for a significant period of time. Definitions
and calculations of comparable store sales differ among companies in the retail industry.
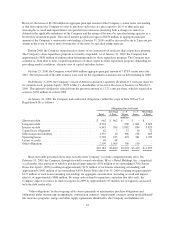
Cost of sales was $15,009 million or 60.3% of net sales for 2008, compared to $15,677 million or 59.6% of
net sales for 2007, a decrease of $668 million. The cost of sales rate for 2008 as a percent of net sales reflects the
weak sales trend and resulting increased net markdowns taken to maintain inventories at appropriate levels. The
valuation of department store merchandise inventories on the last-in, first-out basis did not impact cost of sales in
either period.
SG&A expenses were $8,481 million or 34.1% of net sales for 2008, compared to $8,554 million or 32.5%
of net sales for 2007, a decrease of $73 million. The SG&A rate as a percent to net sales was higher in 2008, as
compared to 2007, primarily because of weaker sales. SG&A expenses in 2008 benefited from consolidation-
related expense savings, lower selling-related costs, lower depreciation and amortization expenses, lower stock
18